はじめに
HoG(Histogram of Oriented Gradients)は、画像認識やコンピュータビジョンの分野で広く使用される特徴抽出手法です。この手法は、画像内の勾配方向のヒストグラムを計算することで、物体の形状や輪郭を効果的に捉えることができます。scikit-imageライブラリのskimage.feature.hog関数を使用することで、Pythonでこの手法を簡単に実装できます。
この記事では、HoGを使用した画像特徴抽出の基本的な概念と、scikit-imageでの実装方法について解説します。また、実際の画像データに対してHoGを適用し、その結果を可視化する方法も紹介します。
コード
解説
モジュールのインポート
画像データの読み込み
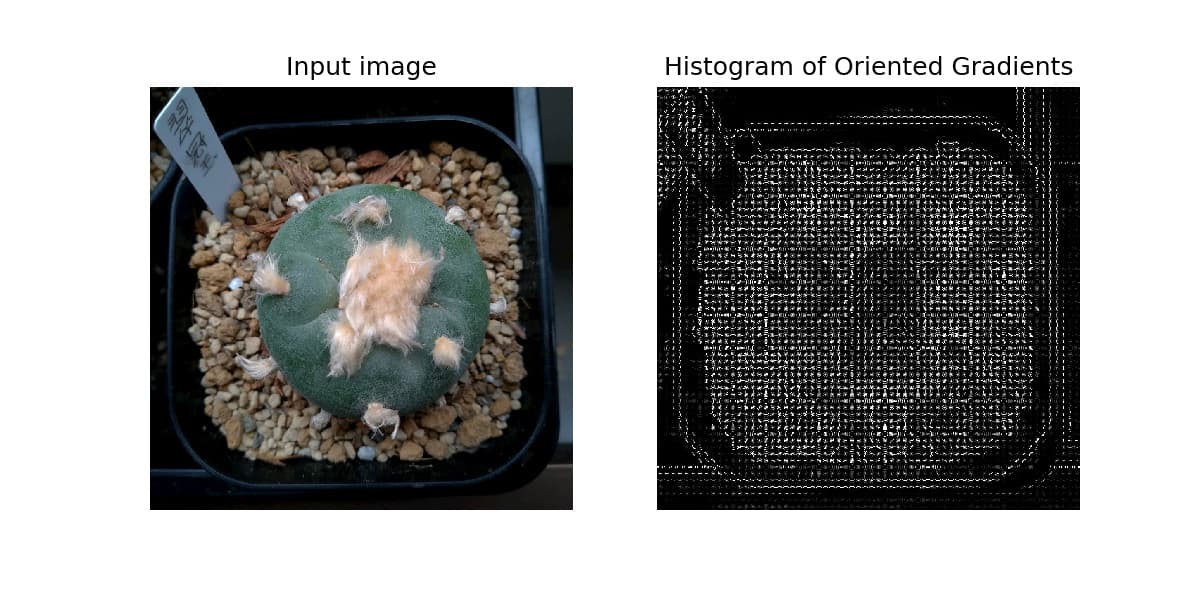
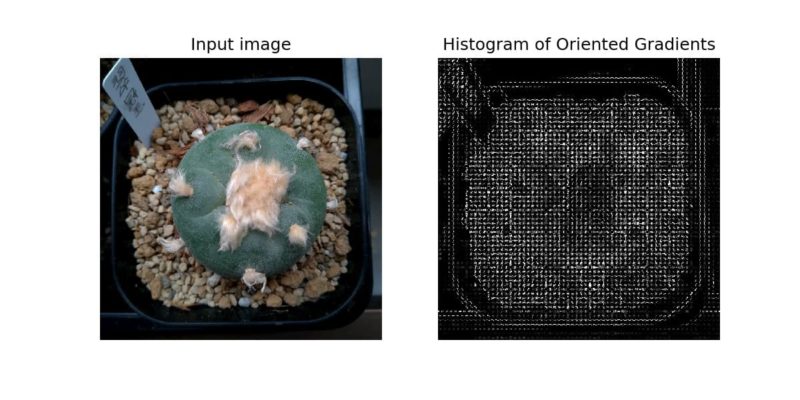
HoG
このコードは画像からHoG特徴量を抽出しています。各パラメータの意味は以下の通りです:
- image: 特徴抽出を行う入力画像
- orientations=8: 勾配方向を8方向に量子化(方向の分割数)
- pixels_per_cell=(16, 16): 各セルのサイズを16×16ピクセルに設定
- cells_per_block=(2, 2): 1ブロックあたり2×2個のセルで構成
- visualize=True: 可視化用のHoG画像も返す設定
- multichannel=True: カラー画像(複数チャンネル)として処理
返り値は2つあり:
- fd: 特徴ベクトル(feature descriptor)
- hog_image: HoG特徴の可視化画像
HoGは画像内の勾配方向の分布を捉えることで、物体検出や画像認識に役立つ特徴量を抽出します。
画像の表示
まとめ
本記事では、scikit-imageのskimage.feature.hog関数を使用したHoG(Histogram of Oriented Gradients)による画像特徴抽出について解説しました。HoGは画像内の勾配方向の分布を捉えることで、物体検出や画像認識タスクに有用な特徴量を抽出できます。
skimage.feature.hog関数の主要なパラメータ(orientations、pixels_per_cell、cells_per_block)の役割と設定方法を理解することで、様々な画像認識タスクに適した特徴抽出が可能になります。また、抽出した特徴量を機械学習アルゴリズムと組み合わせることで、効果的な画像分類システムを構築することができます。
参考

Histogram of Oriented Gradients — skimage 0.26.0 documentation
scikit-image.org

http://lang.sist.chukyo-u.ac.jp/Classes/ComputerVision/KeypointDescription.html#HOG%E8%A8%98%E8%BF%B0%E5%AD%90
lang.sist.chukyo-u.ac.jp

メンテナンス中です
www.jstage.jst.go.jp
コメント