はじめに
scikit-imageの将来モジュール(skimage.future)には、画像解析のための様々な機能が含まれています。本記事では、その中でもrag_boundary関数を使って領域境界グラフ(Region Adjacency Graph, RAG)を構築する方法について解説します。RAGは画像セグメンテーションにおいて、隣接する領域間の関係を表現するための強力なツールです。
コード
解説
モジュールのインポート
画像データの読み込み
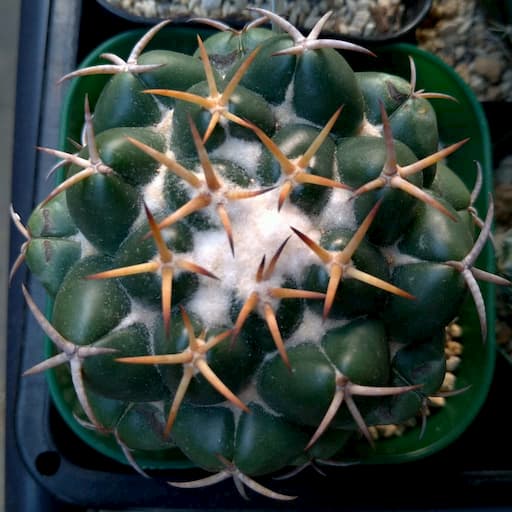
コリファンタ属の象牙丸を用います。rgb2grayによりグレースケール画像とします。
k平均法によるセグメント化
ssegmentation.slic()を使用して、k平均法によるセグメント化を行います。imgはこれからセグメント化する画像です。compactnessパラメータは色の近接性と空間の近接性のバランスを調整します。値を大きくするとスペースの近接度が高まり、セグメント化された領域がより正方形に近い形状になります。このパラメータはログスケール(0.01から100)での調整が推奨されています。n_segmentsは生成される領域の概算数を指定し、値を大きくするとより細かいセグメント化が行われます。
エッジ画像の生成
グレースケール画像からエッジ画像を生成します。sobelフィルタについては下記で説明しました。
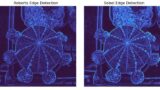
edges_rgb = color.gray2rgb(edges)により1次元のグレースケール画像を3次元のRGB画像とします。
領域境界にもとづくRAG
graph.rag_boundary(labels, edges)を使用して、セグメント化された画像とエッジ画像から領域隣接グラフ(RAG)を構築できます。このとき、隣接する二つの領域間の境界に沿ったピクセルの重みは、edge_mapにおける対応領域の平均値として計算されます。
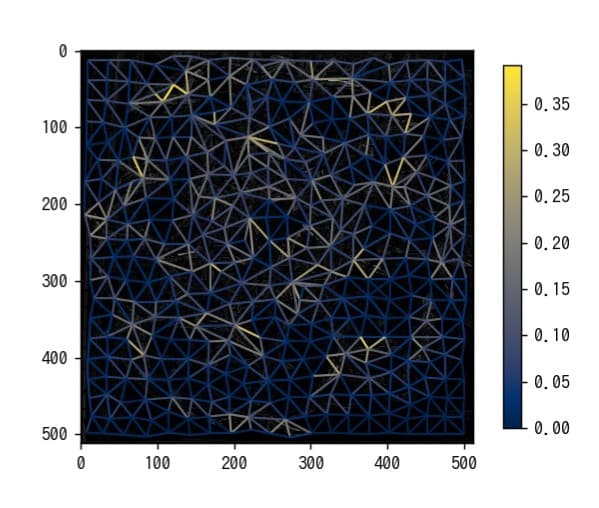
領域隣接グラフを表示
ラベル画像とRAGから、指定されたカラーマップでRAGのノードとエッジを表示できます。入力画像はedges_rgbのようにRGB画像である必要があります。edge_cmapパラメータでエッジのカラーマップを指定でき、edge_widthパラメータで線の太さを調整できます。
コードをダウンロードまとめ
scikit-imageのrag_boundary関数を使うことで、エッジ画像から領域境界グラフ(RAG)を効率的に構築できることを学びました。このグラフ表現は、画像の領域間の関係性を捉え、高度な画像セグメンテーションや解析に活用できます。特に、境界の強度を重みとして利用することで、より精密な領域の統合や分割が可能になります。
参考


コメント