はじめに
本記事では、scikit-learnライブラリのmake_moons関数を使用して、機械学習のテストや実験に役立つ三日月形のデータセットを生成する方法について詳しく解説します。関数のパラメータ設定による分布の変化を紹介していきます。
解説
モジュールのインポートなど
バージョン
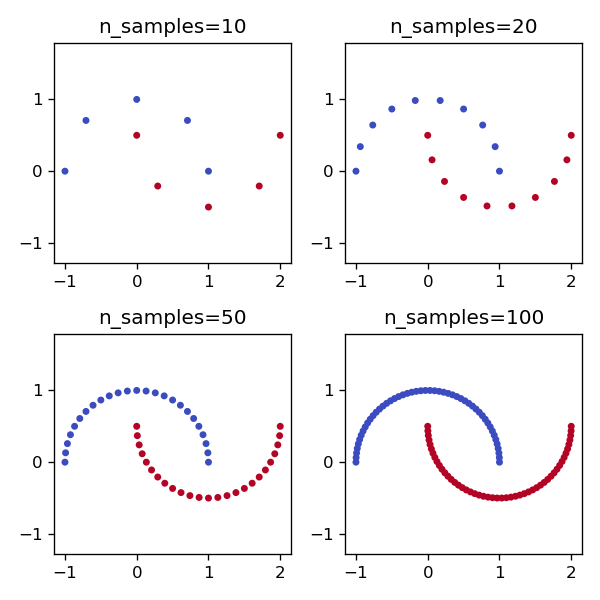
n_samples
n_samplesを変化させることでサンプル数を変えることができる。
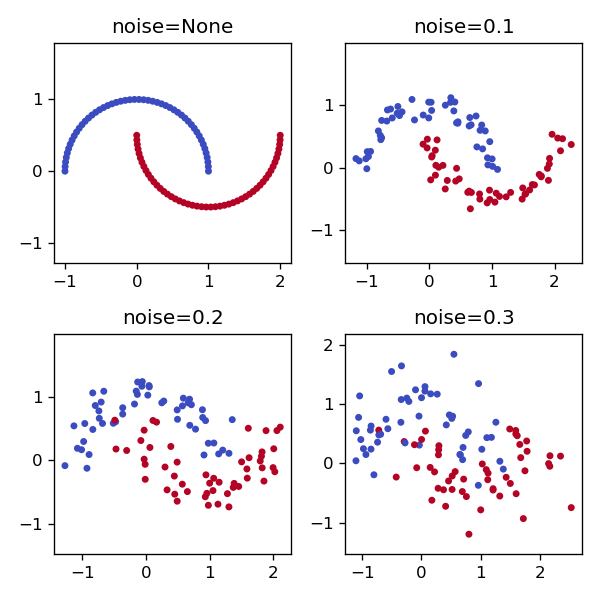
noise
noiseでばらつきを付与できます。
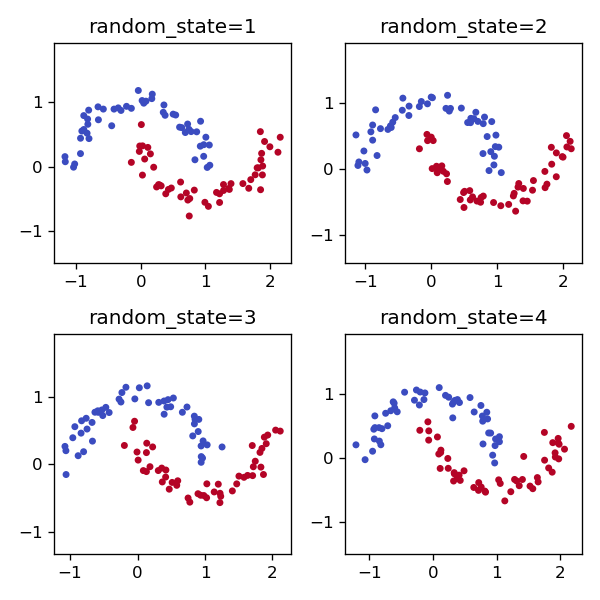
random_state
random_stateを変えることで再現可能な乱数を生成することができます。
shuffle
shuffleパラメータをFalseに設定すると、ラベルがソートされたデータを取得できます。デフォルト値はTrueです。
コードをダウンロード(.pyファイル) コードをダウンロード(.ipynbファイル)参考

make_moons
Gallery examples: Classifier comparison Comparing different clustering algorithms on toy datasets Comparing different hi...
scikit-learn.org

コメント