はじめに
この記事では、SciPyライブラリを使用してボロノイ図を作成する方法について解説します。ボロノイ図は、平面上の点群に対して、各点に最も近い領域で平面を分割する図です。scipy.spatialモジュールのVoronoiクラスとvoronoi_plot_2d関数を使った実装方法を紹介します。
コード
解説
モジュールのインポート
バージョン
データの作成
np.random.rand(12,2)で0から1の値をもつ2次元配列を作成します。
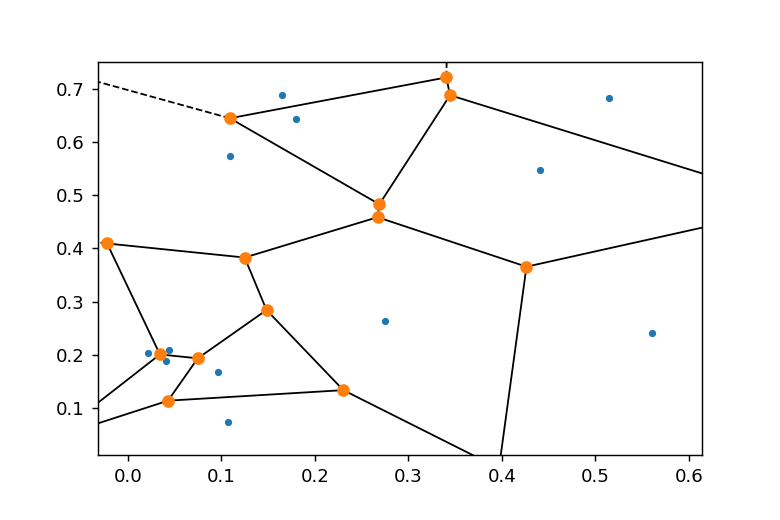
ボロノイ図の作成
Voronoi(points)オブジェクトを「vor」として生成した後、voronoi_plot_2d(vor)関数を呼び出すことでボロノイ図を簡単に作成できます。
図の調整
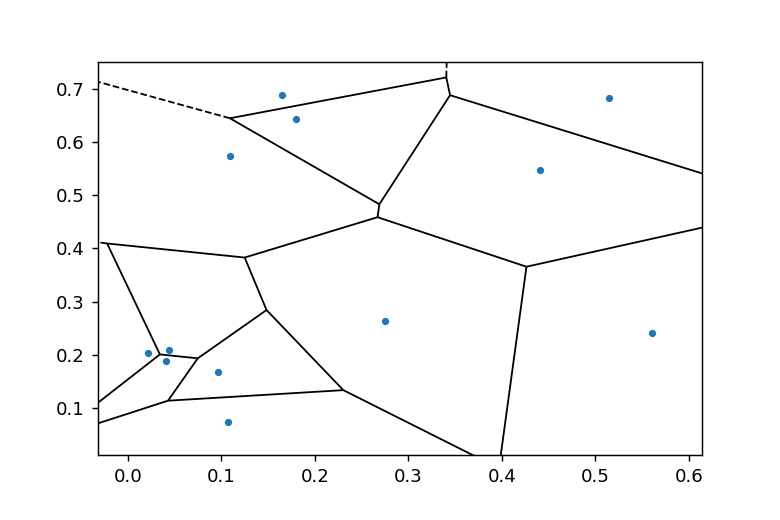
ボロノイ分割の頂点を非表示にする
show_vertices=Falseで頂点を非表示にできます。
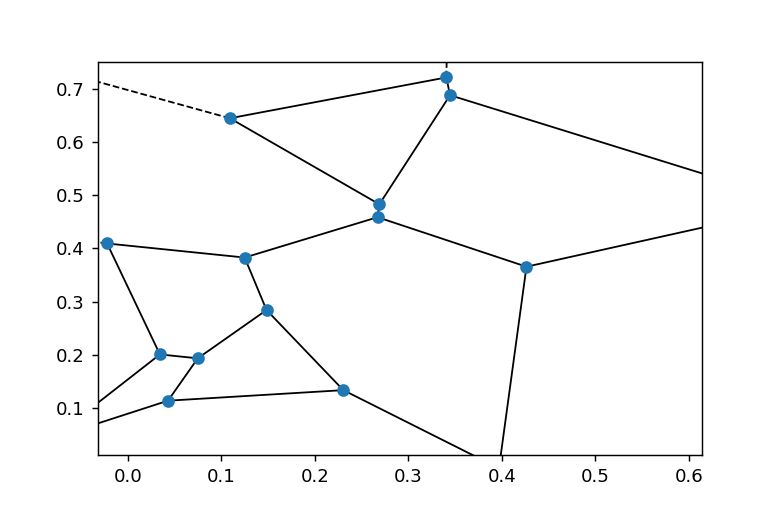
データ点を非表示にする
show_points=Falseでデータ点を非表示にできます。
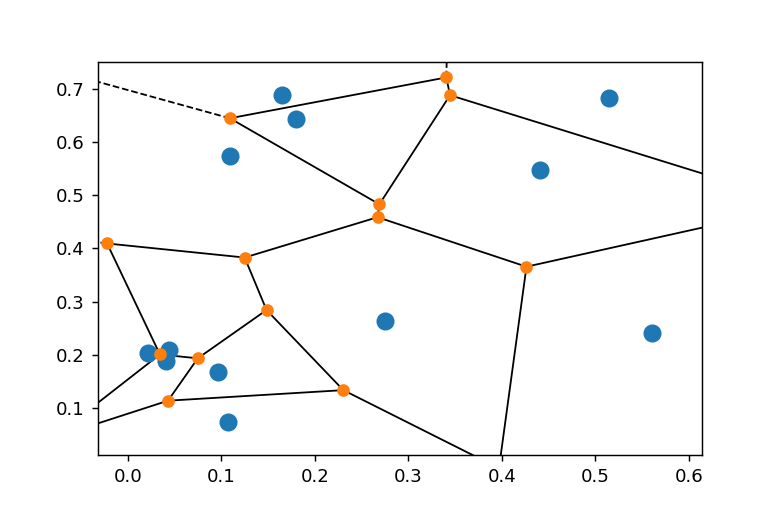
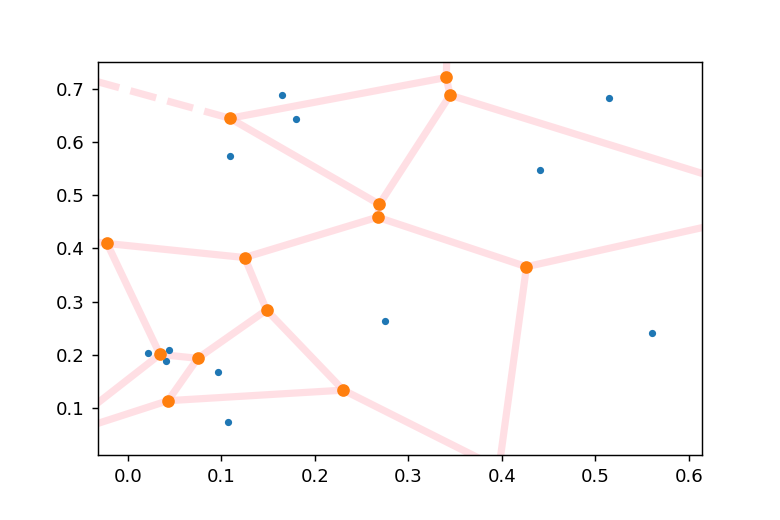
点のサイズを変更する
point_sizeによりデータ点のサイズを変更することができます。
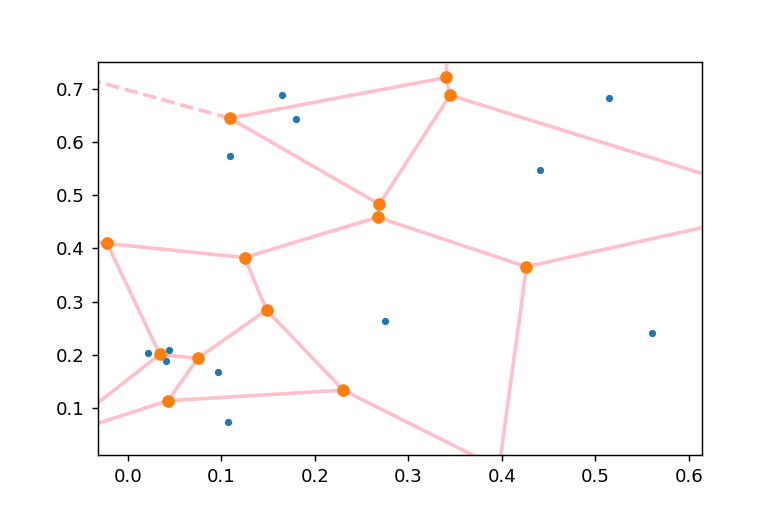
分割線のスタイルを変更する
line_colors, line_width, line_alphaにより線の外観を変更できます。
任意のaxにボロノイ図をいれる
voronoi_plot_2dでは、subplotsで作成したaxに対して、ax=axパラメータを指定することで、そのaxにボロノイ図を描画できます。
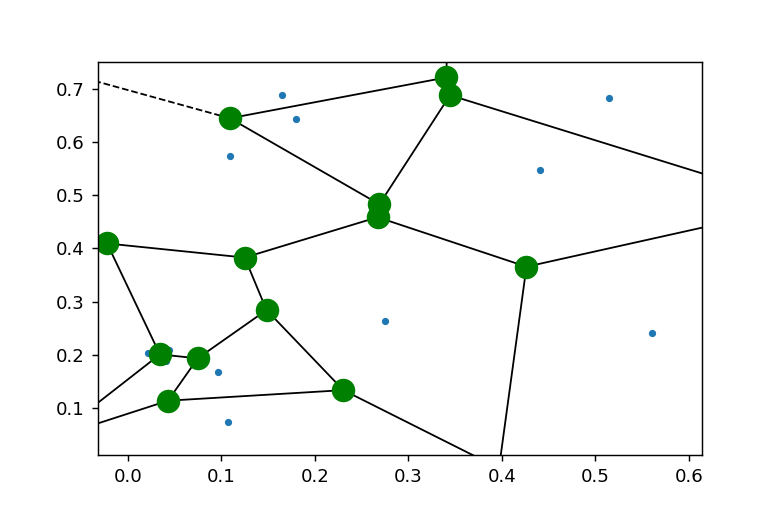
ボロノイ分割の頂点のサイズの変更
vor.verticesを使用すると頂点の座標が取得でき、それをボロノイ図上に重ねて表示できます。
まとめ
SciPyのvoronoi_plot_2d関数を使うことで、簡単にボロノイ図を作成できることを紹介しました。この手法は地理情報システム、画像処理、ネットワーク設計など様々な分野で活用できます。scipy.spatialモジュールの他の機能と組み合わせることで、より高度な空間分析も可能です。
参考

ボロノイ図 - Wikipedia
ja.wikipedia.org

voronoi_plot_2d — SciPy v1.17.0 Manual
docs.scipy.org

コメント