はじめに
ボロノイ図は、空間を特定の点(母点)に最も近い領域に分割する図形です。様々な分野で活用されており、地理情報システム、都市計画、パターン認識などで利用されています。本記事では、SciPyライブラリのspatialモジュールを使って塗りつぶしボロノイ図を作成する方法を解説します。
コード&解説
モジュールのインポート
バージョン
デフォルトのカラーサイクルの変更
デフォルトの”tab10″から”Set3″にカラーサイクルを変更します。
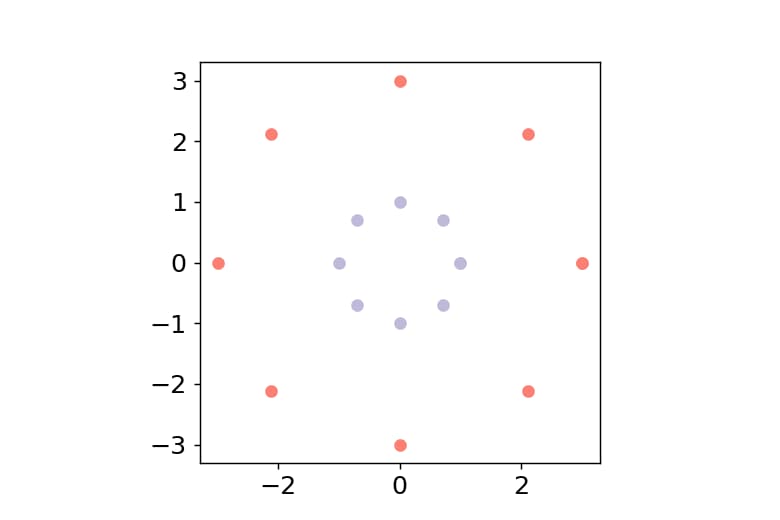
データの作成
半径の異なる円状のデータを作成します。図で表示すると以下のようになります。
ボロノイ図の作成
配列を結合して、Voronoiでボロノイ図を表示するためのデータを作成します。
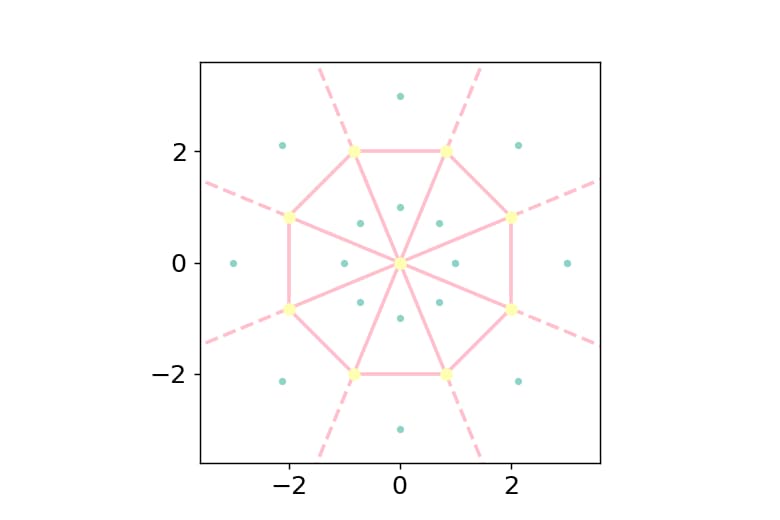
ボロノイ図の表示
ボロノイ図は
voronoi_plot_2d関数を使って表示することができます。この関数の詳細については、下記記事で解説しています。
[SciPy] 10. voronoi_plot_2dによるボロノイ図の作成
SciPyライブラリのscipy.spatialモジュールを使ってボロノイ図を作成する方法を解説。Voronoiクラスによる計算からvoronoi_plot_2d関数を使った可視化まで、サンプルコードと共に詳しく紹介します。
sabopy.com
2020.11.29
ボロノイ図は下図のようになります。
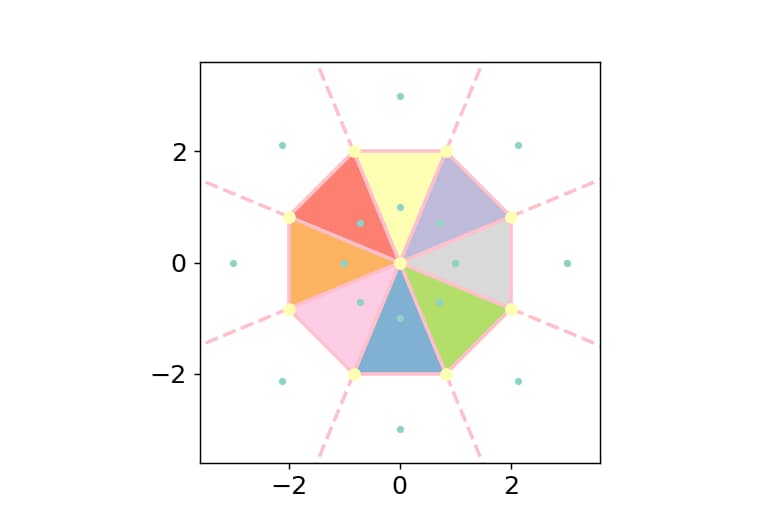
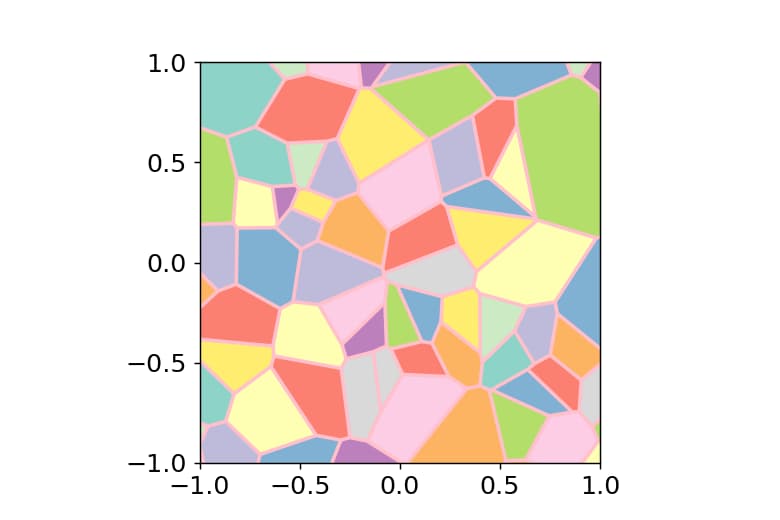
塗りつぶしボロノイ図の表示
vor.regionsからボロノイ領域を形成する頂点のインデックスを取得し、vor.vertices[region]で塗りつぶす領域を決定します。vor.regionsに-1が含まれる場合は、その頂点がボロノイ図の外側にあることを意味するため、if -1 not in region:という条件で、そのような領域は塗りつぶさないようにします。
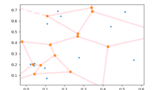
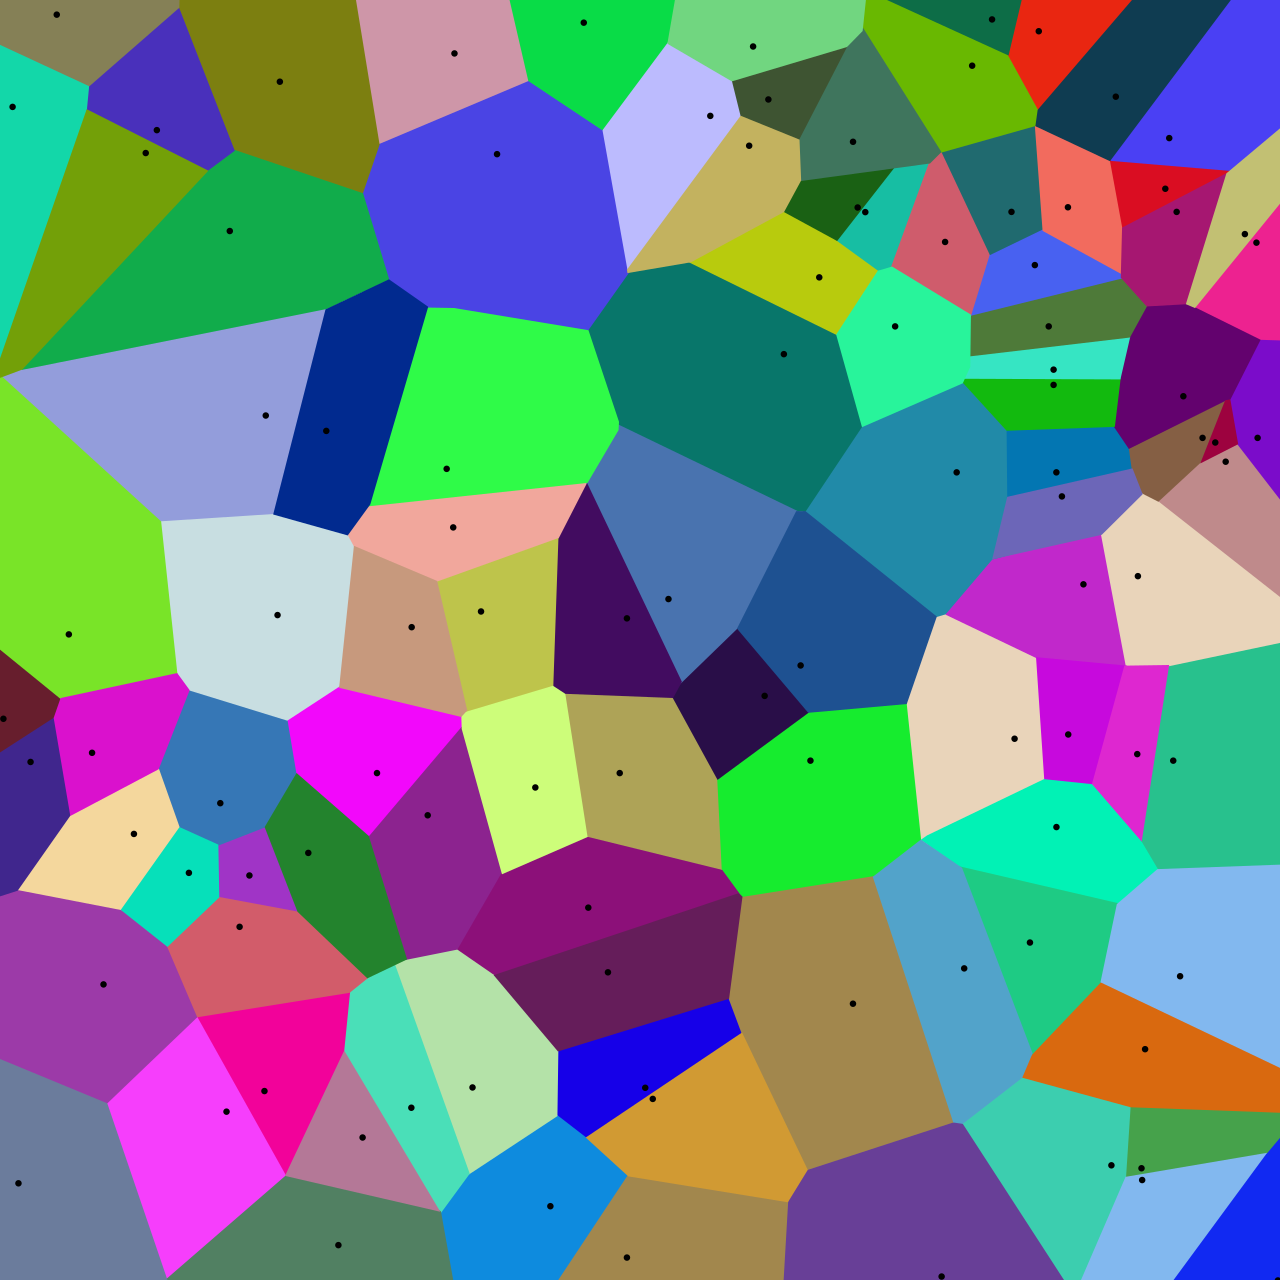
ランダムデータの場合
まとめ
SciPyのspatialモジュールを使用すると、簡単に美しいボロノイ図を作成できます。本記事では基本からカスタマイズ、応用例まで幅広く解説しました。ボロノイ図は視覚的に美しいだけでなく、様々な実用的な応用があるため、データ可視化や計算幾何学の分野で重要なツールとなっています。
参考
ボロノイ図 - Wikipedia
ja.wikipedia.org

Voronoi — SciPy v1.17.0 Manual
docs.scipy.org

voronoi_plot_2d — SciPy v1.17.0 Manual
docs.scipy.org

コメント