はじめに
Seaborn-imageはmatplotlibベースの画像可視化ライブラリで、本記事ではParamGridを使用して各種フィルタのパラメータ変化による結果を一括表示する方法について解説します。

コード&解説
インストール
condaの方は
conda install -c conda-forge seaborn-imagepipの方は
pip install -U seaborn-imageでインストールできます。
モジュールのインポート
seaborn_image は isnsとして読み込みます。
バージョン
全体の設定
isns.set_image関数を使用して、デフォルトのカラーマップを”viridis”に設定し、画像の原点位置を上部(upper)に指定します。
データの読み込み
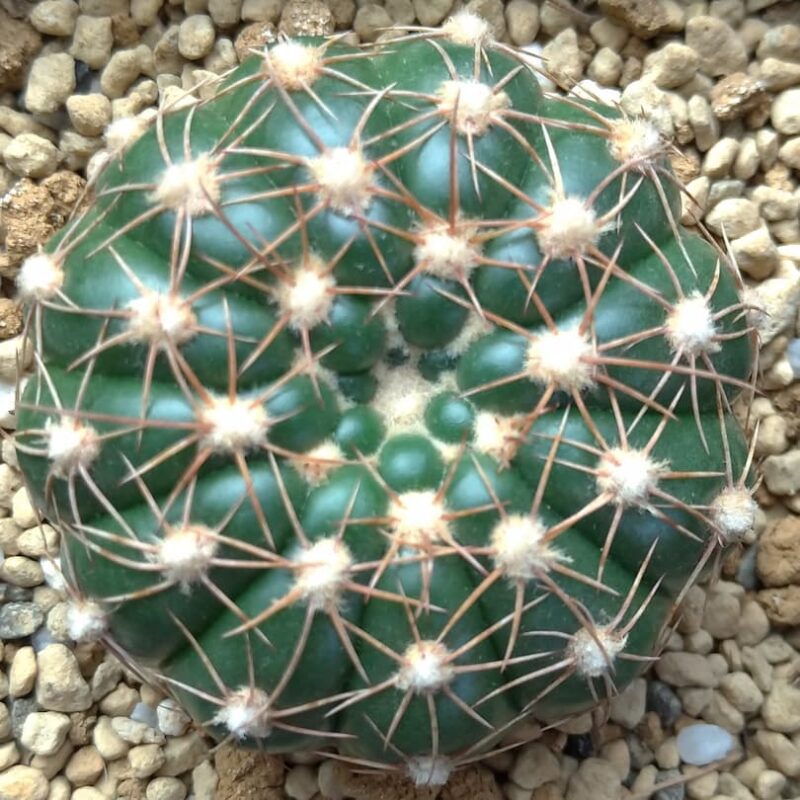
サボテンのすみれ丸の画像を読み込みます。以下の画像を使用し、rgb2gray関数でグレースケール画像に変換しました。
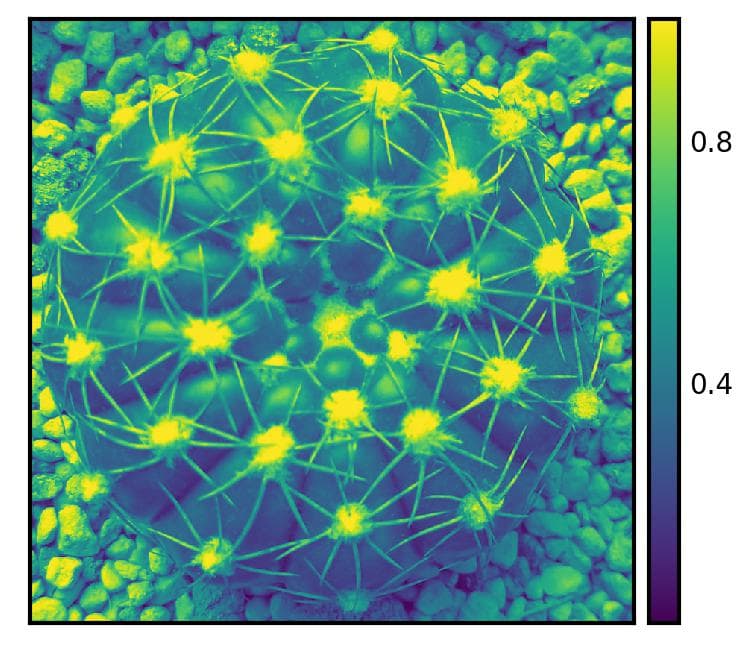
グレースケール画像をisnsのimgplotで表示すると以下のようになります。
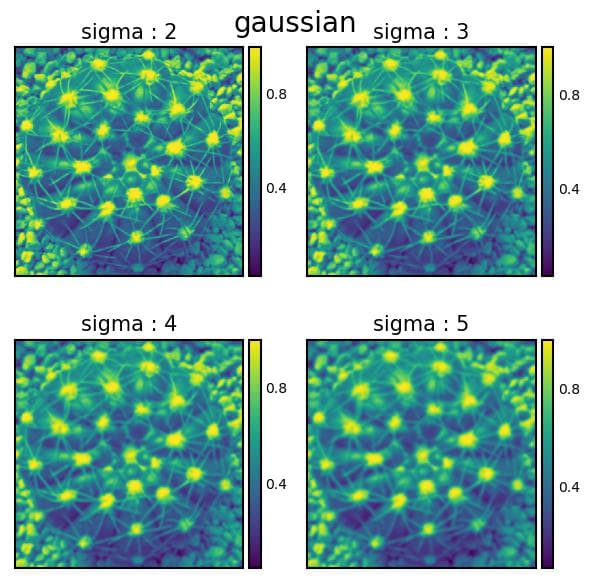
ParamGrid ガウシアンフィルタ
ParamGridでは、col=”sigma”, sigma=[2,3,4,5]と指定することで、sigmaの値を2から5まで変化させた結果をまとめて表示できます。また、col_wrap=2を設定すると、結果を2列で整理して表示することが可能です。
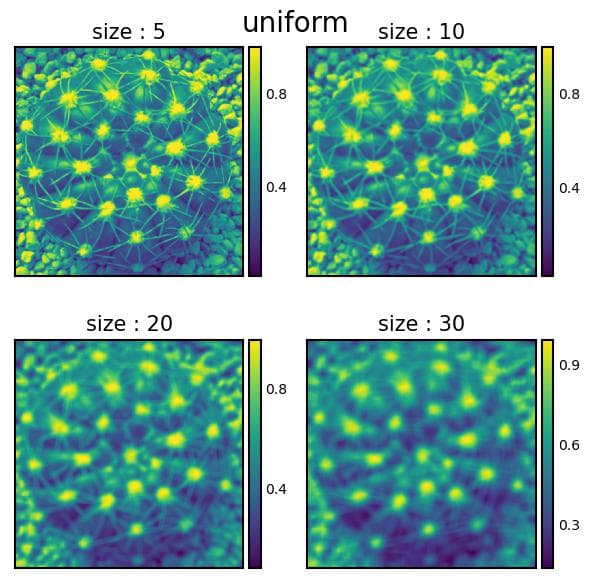
uniformフィルタ
平均フィルタのsizeを変化させる場合も、ガウシアンフィルタと同じ方法で処理できます。
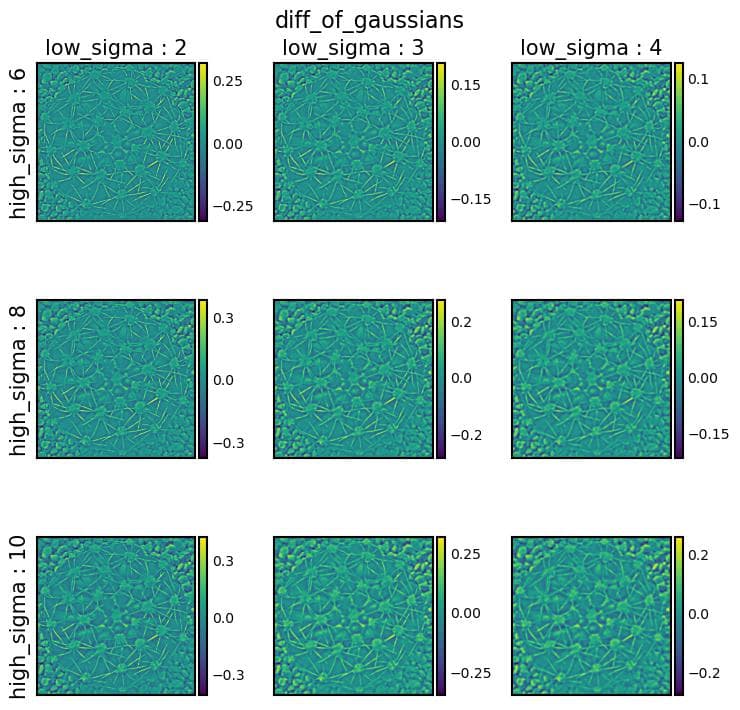
diff_of_gaussians
diff_of_gaussians(バンドパスフィルタ)の場合、colに”low_sigma”、rowに”high_sigma”を設定し、それぞれの値をリスト形式で指定することで、結果をまとめて表示できます。
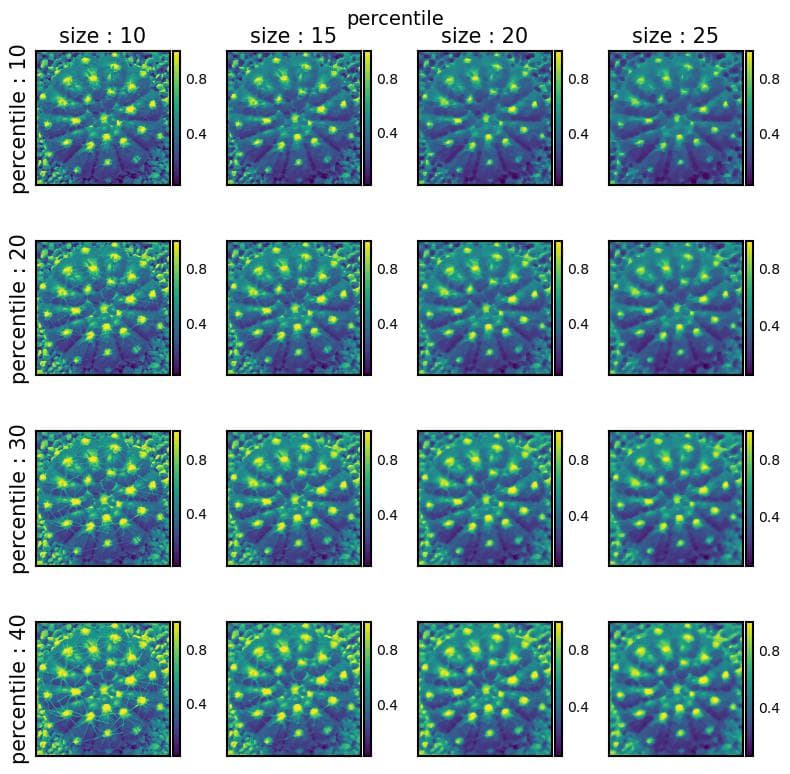
percentile
percentileフィルタを使用する場合、percentileとsizeのパラメータを変化させてParamGridで表示すると以下のようになります。
まとめ
本記事では、Seaborn-imageライブラリのParamGrid機能を活用して、複数のフィルタパラメータを効率的に比較・検証する方法を紹介しました。この手法により、画像処理における最適なパラメータ選択が容易になり、データ分析ワークフローを効率化することができます。
参考


コメント