 python
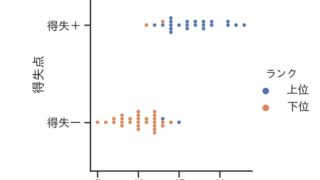
 [seaborn] 8. stripplotとswarmplotで各カテゴリーのデータを散布図で表示
Pythonのseabornライブラリにおけるstripplotとswarmplotの使い方を解説します。これらの関数を使って各カテゴリーのデータを散布図として視覚化し、分布の特徴を効果的に表現する方法を学びましょう。
python 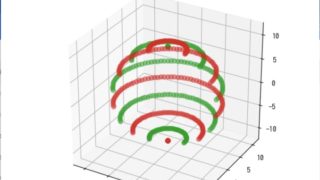 matplotlib 3D
  matplotlib
 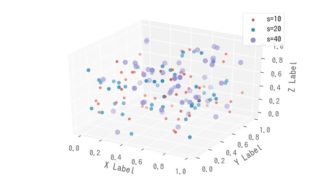 matplotlib 3D