 matplotlib
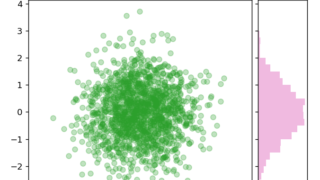
 [matplotlib] 21. ヒストグラム付き散布図
matplotlibのaxes_grid1を使って散布図と同時にX軸・Y軸方向のヒストグラムを表示する方法を解説。データの2次元分布と各軸の分布を効率的に可視化するテクニックを紹介しています。
matplotlib  matplotlib
  matplotlib