 matplotlib
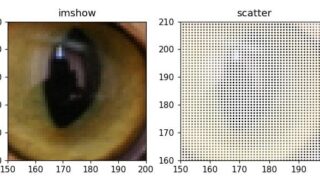
 [matplotlib] 121. 散布図の点で画像を表示する
matplotlibのscatter関数を使った点描画技法で画像を表現する方法を解説します。通常のimshow関数との違いや視覚効果の特徴、実装方法について詳しく説明し、データビジュアライゼーションの新たな表現手法を紹介します。
matplotlib  matplotlib
  matplotlib
  matplotlib
 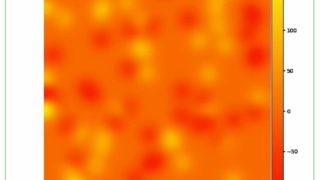 matplotlib
  matplotlib
  その他
その他