はじめに
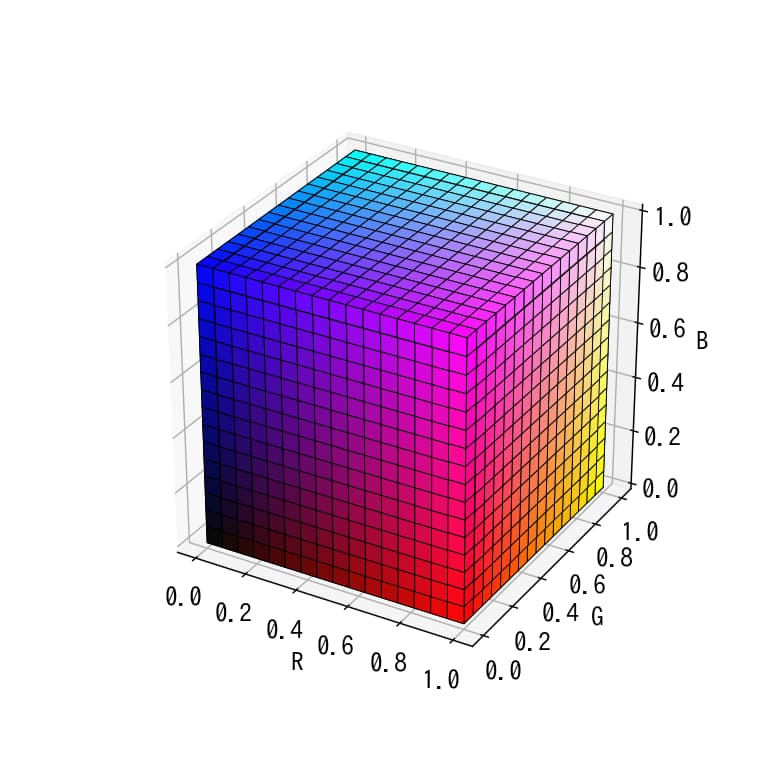
matplotlibの3DボクセルグラフでRGB色空間を視覚的に表現する方法について解説します。
コード
解説
RGB cubeは下記記事を参考にして作成しました。
[matplotlib 3D] 30. voxelグラフでRGB色空間を可視化
Matplotlibの3Dグラフ機能を使って、RGB色空間をvoxelグラフで可視化する方法を解説します。3次元空間での色の分布を理解し、視覚的に表現することで、色彩理論への理解を深めることができます。
sabopy.com
上記記事と異なる部分は、以下の部分です。
回転アニメーション
回転アニメーションは以下の記事を参考に作成しました。
[matplotlib 3D] 14. 3Dグラフの回転アニメーション
matplotlibのmplot3dを使用して3Dグラフの回転アニメーションを作成する方法を解説します。動画として保存する手順や回転角度の制御など、3Dビジュアライゼーションを動的に表現するための基本テクニックを紹介します。
sabopy.com
2018.10.25
参考

3D voxel / volumetric plot with rgb colors — Matplotlib 3.1.2 documentation
matplotlib.org
コメント