matplotlib Animation 
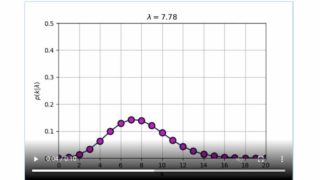
[matplotlib animation] 11. ポアソン分布のアニメーション matplotlibのFuncAnimationを使用してポアソン分布のパラメータλの変化をアニメーション表示する方法を解説。統計学の理解を深めるための視覚的なアプローチを提供し、Pythonによる動的なデータ可視化の実装例を紹介しています。 2018.12.07 matplotlib Animationpython
matplotlib 3D [matplotlib 3D] 41. 円錐台(Truncated cone) このページでは、matplotlibのmplot3dモジュールを使用して円錐台(Truncated cone)を3Dで表示する方法を解説します。円錐台の半径や高さを調整し、視覚的に美しい3Dグラフを作成する手順を紹介します。 2018.12.07 matplotlib 3Dpython
matplotlib Animation [matplotlib animation] 10. ガンマ分布のアニメーション Pythonのmatplotlibライブラリを使ってガンマ分布のパラメータ変化をアニメーション化する方法を解説。形状母数と尺度母数の変化に伴う確率密度関数の挙動を視覚的に学べる実装例を提供します。 2018.12.07 matplotlib Animationpython
matplotlib Animation [matplotlib Animation] 9. 螺旋トーラスのアニメーション matplotlib FuncAnimationによる螺旋トーラスのアニメーション 2018.12.04 matplotlib Animationpython
matplotlib 3D [matplotlib 3D] 40.トーラス(Torus) Matplotlibを使用したトーラス(ドーナツ形状)の3D描画方法を解説。パラメトリック方程式による実装例やカスタマイズ方法を紹介し、3Dグラフィックスの基礎知識を深められる内容です。 2018.12.03 matplotlib 3Dpython
matplotlib 3D [matplotlib 3D] 39.二葉双曲面を3Dプロットで表現(Hyperboloid) 二葉双曲面(Hyperboloid)をmatplotlibの3Dプロットで表現する方法を解説します。このグラフィカルな手法は、数学的な概念を視覚的に理解するのに役立ちます。Python、matplotlib、NumPyを使用した実装例とコード解説を提供します。 2018.12.03 matplotlib 3Dpython
matplotlib Animation [matplotlib animation] 8. 3Dグラフの軸範囲更新アニメーション matplotlibのFuncAnimationを使用した3Dグラフの軸範囲更新アニメーションの作成方法を解説。コード例を交えながら、視点変更や表示範囲の動的更新による効果的なデータ可視化テクニックを紹介しています。 2018.12.03 matplotlib Animationpython
matplotlib 3D [matplotlib Animation] 7. 双曲面の拡張アニメーション このページでは、matplotlib FuncAnimationを用いた双曲面の拡張アニメーションについて説明します。3Dグラフの動的な表示方法や、双曲面を徐々に変形させる技術を解説しています。Pythonでの数学的可視化に役立つ内容です。 2018.12.03 matplotlib 3Dmatplotlib Animationpython