 matplotlib
 [matplotlib] 95. subplot_mosaicによる年賀状
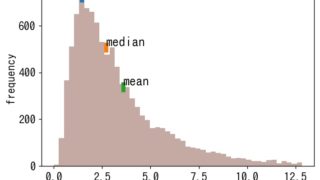
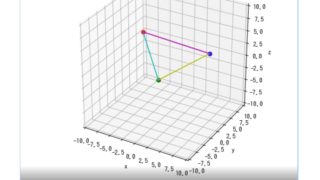
matplotlibのsubplot_mosaic機能を使って年賀状を作成する方法を解説。アスキーアート的なレイアウト指定で複数の図を配置し、Python初心者でも簡単にオリジナルの年賀状が作れるようになります。
 matplotlib
  matplotlib
  matplotlib Animation