matplotlib [matplotlib] 64. 軸ラベルを2段にして重ならなようにする方法 
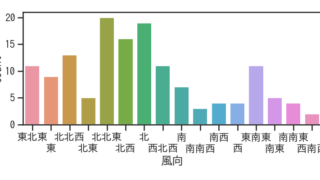
軸ラベルが多い場合に、視認性を保ったままコンパクトに表示する方法を解説します。matplotlib で軸ラベルを2段に分けることで、ラベル同士が重なることなく、読みやすいグラフを作成する技術を紹介しています。 2020.03.16 matplotlibpython
matplotlib Animation [matplotlib animation] 69. カウントダウンアニメーション matplotlibのFuncAnimationでテキストによるカウントダウンアニメーションを表示する。 2020.02.04 matplotlib Animationpython
matplotlib [matplotlib] 49. Fancytextboxのボックススタイルについて matplotlibでtextを表示する際に四角(Fancytextbox)で囲むことができる。ここでは、Fancytextboxのスタイルについて説明する。 2019.11.11 matplotlibpython
matplotlib [matplotlib] 48. textのrotationにhorizontalalignment, verticalalignmentが及ぼす影響 matplotlibでtextを回転させるときに、horizontalalignment (ha)と verticalalignment (va)が回転に及ぼす影響について説明する。 2019.11.08 matplotlibpython
matplotlib 3D [matplotlib animation] 48. 3Dグラフ上でのテキストのアニメーション matplotlib のアニメーション機能を使用して、3D グラフ上でテキストを動的に表示・移動させる方法を解説します。mplot3d と animation モジュールを組み合わせ、3D 空間内でのテキストアニメーションの実装方法や応用例を紹介しています。 2019.06.22 matplotlib 3Dmatplotlib Animationpython
matplotlib [matplotlib] 11. テキストと矢印 matplotlibでテキストと矢印を追加する方法を解説した記事です。グラフ上でのテキスト配置、矢印の描画、注釈の追加方法について、実際のコード例とパラメータの説明を提供しています。データ可視化をより分かりやすく効果的にするための手法を学べます。 2019.02.21 matplotlibpython
matplotlib 3D [matplotlib 3D] 21. 3Dグラフにテキストを表示する方法 Matplotlibのmplot3dモジュールを使用して3Dグラフにテキストを追加する方法を解説。グラフ上の特定座標にラベルやアノテーションを配置する手法から、フォントサイズや色の調整まで、3D空間でのテキスト表示テクニックを紹介します。 2018.10.18 matplotlib 3Dpython