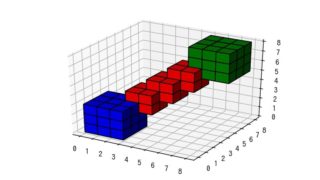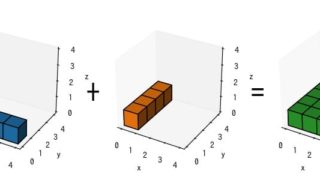
matplotlib 3D [NumPy] 7. ブロードキャスト NumPyによるブロードキャストをボクセルグラフで視覚的に示す。 2018.12.11 matplotlib 3DNumPypython
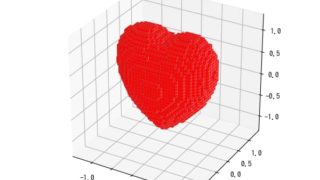
matplotlib 3D [matplotlib 3D] 32. voxelグラフでハートを表示して回転する matplotlib mplot3d voxelグラフでハート♡を表示する。回転アニメーションも表示する。 2018.11.01 matplotlib 3Dpython
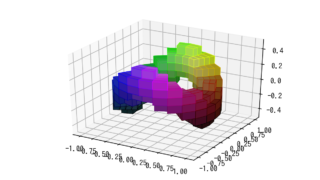
matplotlib 3D [matplotlib 3D] 31. voxels_torus matplotlib mplot3dのvoxelでトーラスを表示。 2018.10.31 matplotlib 3Dpython
matplotlib 3D [matplotlib 3D] 30. voxelグラフでRGB色空間を可視化 matplotlibのvoxelグラフで各ボクセルの色を変化させる例として、グラフで各座標位置の値に対応するrgbを当てはめた球を表示する。 2018.10.30 matplotlib 3Dpython
matplotlib 3D [matplotlib 3D] 29. NumPyの以前のlogoをvoxelで表示 NumPyのロゴをmatplotlib mplot3dのvoxelグラフで表示する方法について説明する。 2018.10.29 matplotlib 3DNumPypython
matplotlib 3D [matplotlib 3D] 28. Pythonで3D voxelグラフ 3D voxelグラフの作成について解説する。 2018.10.29 matplotlib 3Dpython