はじめに
このページでは、Seabornライブラリのsns.stripplot関数を使用して、カテゴリカルデータの散布図(ジッタープロット)にカスタム画像をマーカーとして適用する方法について解説します。
コード&解説
モジュールのインポートなど
バージョン
データの作成
ランダムデータのDataFrameを作成します。以下のようなデータになっています。
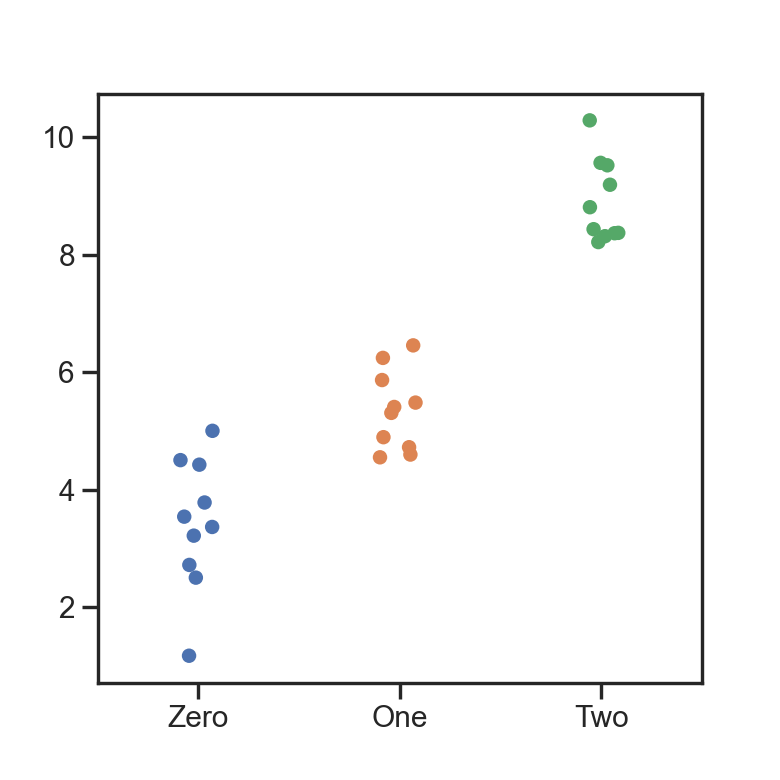
sns.stripplotでジッタープロットを表示
stripplotで jitter=.1とすることでジッタープロットを表示できます。
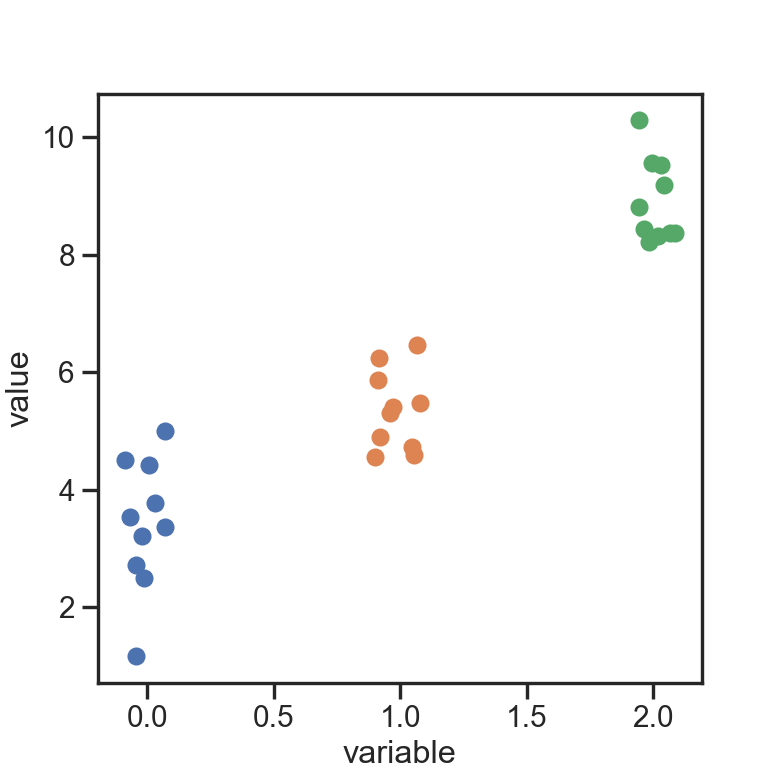
stripplotからデータ取得
stripplotで表示したデータはp.collections[0].get_offsets().dataのように取得できます。
このようにして取得したデータは以下の形式になっています。
matplotlibのax.plot()で取得したデータを表示
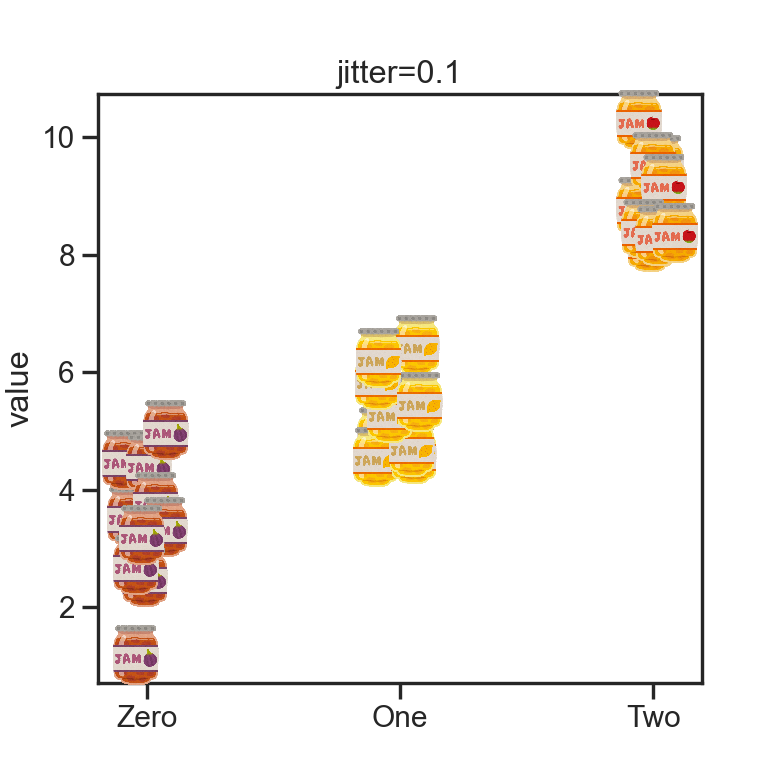
ジッタープロットのマーカーを画像にして表示
画像をプロットする関数
下記ページと同様の関数を用います。
[matplotlib] 3. 画像マーカープロットを使った効果的なデータ可視化
matplotlibを使用して画像をマーカーとしてプロットする方法を解説。通常のデータ可視化に画像アイコンを取り入れることで、より視覚的にインパクトのあるグラフを作成。地図上の位置表示や気象データなど実用例も紹介。
sabopy.com
2018.11.06
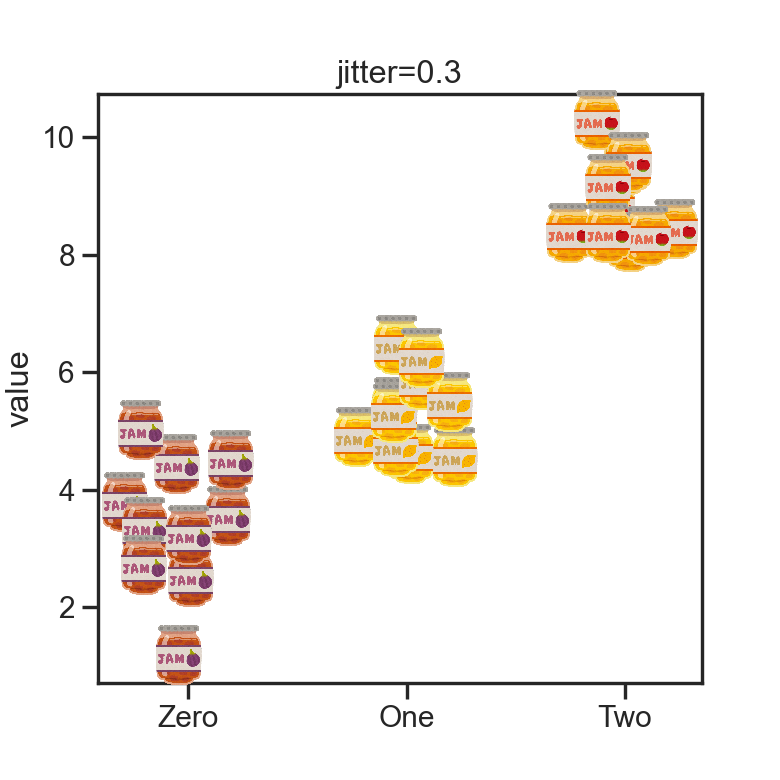
画像ジッタープロットの表示
画像は下記サイトから取得しました。

いろいろなジャムのイラスト
いらすとやは季節のイベント・動物・子供などのかわいいイラストが沢山見つかるフリー素材サイトです。
www.irasutoya.com
jitter=0.3とした場合
参考

seaborn.stripplot — seaborn 0.13.2 documentation
seaborn.pydata.org

コメント