Loading [MathJax]/extensions/tex2jax.js

[matplotlib animation] 45. skimage.transform.swirlのradius変化アニメーション

matplotlib Animation

はじめに

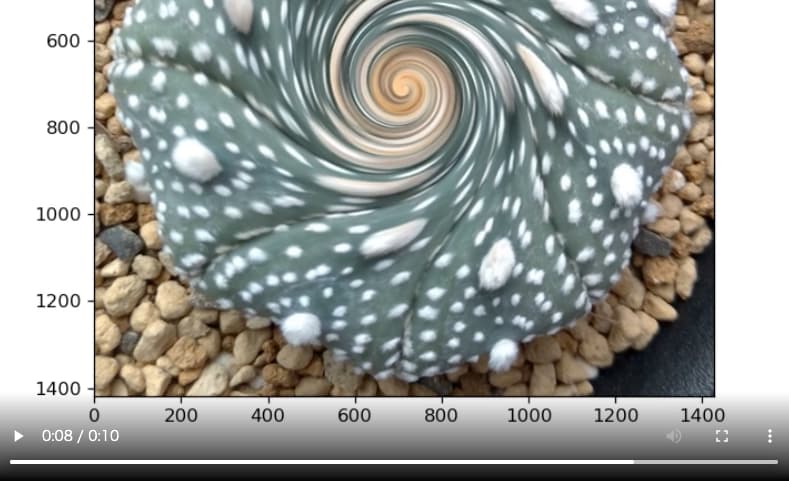
画像の非線形変換である渦巻き(skimage.transform.swirl)のパラメータ(radius)を変化させたときの画像の変化をmatplotlib FuncAnimationのアニメーションで表示する。
radiusを増加させることで、旋回の及ぶ範囲が拡大していくことが確認できる。

コード

%matplotlib
import matplotlib.pyplot as plt
from skimage.transform import swirl
import matplotlib.animation as animation
from IPython.display import HTML
#load image
img = plt.imread('kabutomaru.jpg')
#make swirled images
swirled_imgs=[]
for i in range(40):
swirled = swirl(img, rotation=0, strength=15, radius=20*(i+1))
swirled_imgs.append(swirled)
#animation
fig, ax= plt.subplots(figsize=(6,6))
def update(num):
ax.cla()
ax.imshow(swirled_imgs[num])
ax.set_title("radius="+str(20*(num+1)))
ani = animation.FuncAnimation(fig, update, 40, interval=250)
ani.save('swirl_anim.mp4', writer="ffmpeg",dpi=120)
HTML(ani.to_html5_video())

解説

モジュールのインポート

%matplotlib
import matplotlib.pyplot as plt
from skimage.transform import swirl
import matplotlib.animation as animation
from IPython.display import HTML

バージョン

#version
import matplotlib
print(matplotlib.__version__)
3.4.3
import skimage
print(skimage.__version__)
0.18.3

画像の読み込み

#load image
img = plt.imread('kabutomaru.jpg')

読み込んだ画像をimshowで表示すると下のようになる。

渦巻画像の作成

#make swirled images
swirled_imgs=[]
for i in range(40):
swirled = swirl(img, rotation=0, strength=15, radius=20*(i+1))
swirled_imgs.append(swirled)

radiusを変化させた渦巻画像を作成し、リストに入れてゆく。

[scikit-image] 24. 画像の非線形変換(渦巻き模様:transform.swirl)
ここでは、skimage.transformのswirlを用いた画像の非線形変換(渦巻き)について説明する。

アニメーションの設定

fig, ax= plt.subplots(figsize=(6,6))
def update(num):
ax.cla()
ax.imshow(swirled_imgs[num])
ax.set_title("radius="+str(20*(num+1)))

逐次、現在の画像を消して新しい画像を表示するという方法でアニメーション表示をするので、ax.cla()により、古い画像を消す。

ax.imshow(swirled_imgs[num])で渦巻画像を順次表示していき、タイトルに変化するradiusの値を表示する。

アニメーションの表示

ani = animation.FuncAnimation(fig, update, 40, interval=250)
ani.save('swirl_anim.mp4', writer="ffmpeg",dpi=120)
HTML(ani.to_html5_video())

40stepアニメーション関数を実行して、250 ms間隔で順次図をかえていくので、10 secのアニメーションとなる。
HTML(ani.to_html5_video())とすればjupyter notebook, lab上にアニメーションを表示できる。

コードをダウンロード(.pyファイル)

コードをダウンロード(.ipynbファイル)

参考

Swirl — skimage 0.25.2 documentation

コメント