はじめに
jupyter notebookの対話的にパラメータを調整できる機能(ipywidgets IntRangeSlider)で、画像の任意の位置に四角をインタラクティブに表示する方法について説明する。
コード
This file contains bidirectional Unicode text that may be interpreted or compiled differently than what appears below. To review, open the file in an editor that reveals hidden Unicode characters.
Learn more about bidirectional Unicode characters
%matplotlib widget
from ipywidgets import IntRangeSlider,interactive
import numpy as np
import matplotlib.pyplot as plt
from scipy import ndimage
from ipywidgets import HBox
from matplotlib.patches import Rectangle
from mpl_toolkits.axes_grid1 import make_axes_locatable
plt.rcParams['font.size']=12
plt.rcParams['font.family'] = 'sans-serif'
#make data
n = 3
s = 128
im = np.zeros((s, s))
points = (s*np.random.random((2, n**2))).astype(int)
im[points[0], points[1]] = 1000
points = (s*np.random.random((2, n**2))).astype(int)
im[points[0], points[1]] = -1000
im = ndimage.gaussian_filter(im, sigma=s/(5.*n))
fig, ax = plt.subplots(figsize=(5,5))
ax.imshow(im, cmap=plt.cm.gist_earth, interpolation='gaussian',origin='lower')
x_range = IntRangeSlider(min=0, max=127,step=1,value=[0,128], description="xlim: ",
orientation='horizontal')
y_range = IntRangeSlider(min=0, max=127,step=1,value=[0,128], description="ylim: ",
orientation='vertical')
rects = Rectangle((0, 0),0,0,ls=":",lw=2,ec="w",fc="None")
ax.add_patch(rects)
def plot(x_range,y_range):
rects.set_xy([x_range[0],y_range[0]])
rects.set_width(x_range[1]-x_range[0])
rects.set_height(y_range[1]-y_range[0])
w = interactive(plot, x_range=x_range, y_range=y_range)
HBox(children=[y_range,x_range])

解説
モジュールのインポートなど
This file contains bidirectional Unicode text that may be interpreted or compiled differently than what appears below. To review, open the file in an editor that reveals hidden Unicode characters.
Learn more about bidirectional Unicode characters
%matplotlib widget
from ipywidgets import IntRangeSlider,interactive
import numpy as np
import matplotlib.pyplot as plt
from scipy import ndimage
from ipywidgets import HBox
from matplotlib.patches import Rectangle
from mpl_toolkits.axes_grid1 import make_axes_locatable
バージョン
This file contains bidirectional Unicode text that may be interpreted or compiled differently than what appears below. To review, open the file in an editor that reveals hidden Unicode characters.
Learn more about bidirectional Unicode characters
import matplotlib
print(matplotlib.__version__)
3.2.1
print(np.__version__)
1.18.5
import scipy
print(scipy.__version__)
1.4.1
import ipywidgets
print(ipywidgets.__version__)
7.5.1
データの生成
This file contains bidirectional Unicode text that may be interpreted or compiled differently than what appears below. To review, open the file in an editor that reveals hidden Unicode characters.
Learn more about bidirectional Unicode characters
#make data
n = 3
s = 128
im = np.zeros((s, s))
points = (s*np.random.random((2, n**2))).astype(int)
im[points[0], points[1]] = 1000
points = (s*np.random.random((2, n**2))).astype(int)
im[points[0], points[1]] = -1000
im = ndimage.gaussian_filter(im, sigma=s/(5.*n))
画像データは下記記事と同じコードにより生成した。

[matplotlib] 57. plt.imshow()で軸を画像から離して表示
matplotlibのplt.imshowで画像を表示する際に、軸を画像から離して表示する方法について説明する。
画像の表示
This file contains bidirectional Unicode text that may be interpreted or compiled differently than what appears below. To review, open the file in an editor that reveals hidden Unicode characters.
Learn more about bidirectional Unicode characters
fig, ax = plt.subplots(figsize=(5,5))
ax.imshow(im, cmap=plt.cm.gist_earth, interpolation='gaussian',origin='lower')
四角の表示
This file contains bidirectional Unicode text that may be interpreted or compiled differently than what appears below. To review, open the file in an editor that reveals hidden Unicode characters.
Learn more about bidirectional Unicode characters
rects = Rectangle((0, 0),0,0,ls=":",lw=2,ec="w",fc="None")
ax.add_patch(rects)
左下の座標が(0, 0)で幅0、高さ0のRectangleを作成し、ax.add_patch(rects)で図中に入れておく。
ipywidgetsの設定
IntRangeSliderの設定
This file contains bidirectional Unicode text that may be interpreted or compiled differently than what appears below. To review, open the file in an editor that reveals hidden Unicode characters.
Learn more about bidirectional Unicode characters
x_range = IntRangeSlider(min=0, max=127,step=1,value=[0,128], description="xlim: ",
orientation='horizontal')
y_range = IntRangeSlider(min=0, max=127,step=1,value=[0,128], description="ylim: ",
orientation='vertical')
IntRangeSliderで整数で範囲を指定できる。minは最小値で, maxは最大値、stepは刻み幅でvalueは初期値となる。 descriptionでスライダーの前にラベルをつけることができ、orientation=’horizontal’で水平方向、’vertical’で垂直方向にスライダーを設置するこことができる。
This file contains bidirectional Unicode text that may be interpreted or compiled differently than what appears below. To review, open the file in an editor that reveals hidden Unicode characters.
Learn more about bidirectional Unicode characters
def plot(x_range,y_range):
rects.set_xy([x_range[0],y_range[0]])
rects.set_width(x_range[1]-x_range[0])
rects.set_height(y_range[1]-y_range[0])
x_lim、y_limのスライダーで選択した範囲に四角が表示されるように、四角の左下位置をset_xyで設定し、幅をset_width、高さをset_heightで設定する。
IntRangeSliderの表示
This file contains bidirectional Unicode text that may be interpreted or compiled differently than what appears below. To review, open the file in an editor that reveals hidden Unicode characters.
Learn more about bidirectional Unicode characters
w = interactive(plot, x_range=x_range, y_range=y_range)
HBox(children=[y_range,x_range])
iinteractではなく、interactiveを用いる。
intaractiveとすることでHBox(children=[y_range,x_range])などのようにipywidgrtsのレイアウト変更が可能となる。
Hboxで横方向にwidgetsが並ぶことになる。
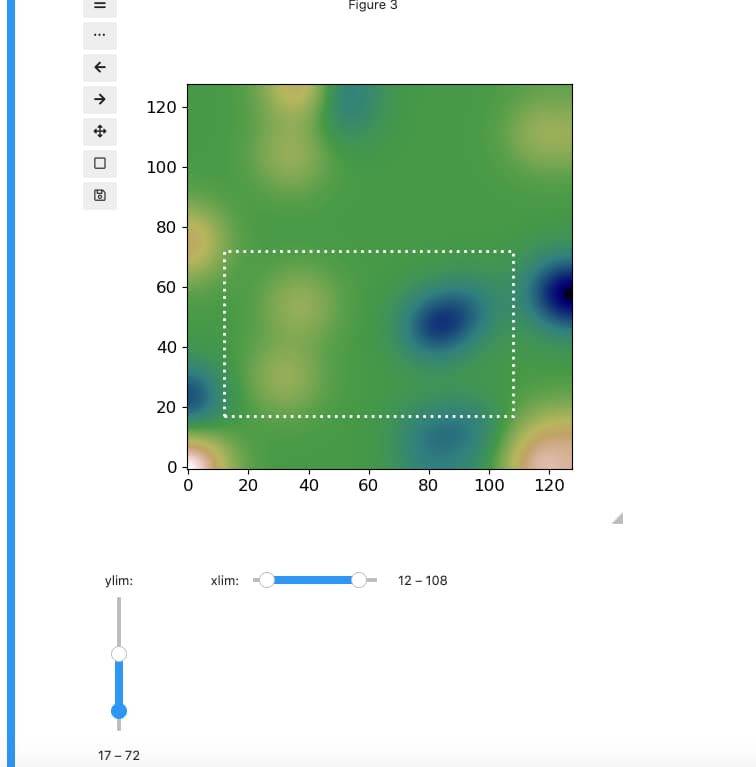
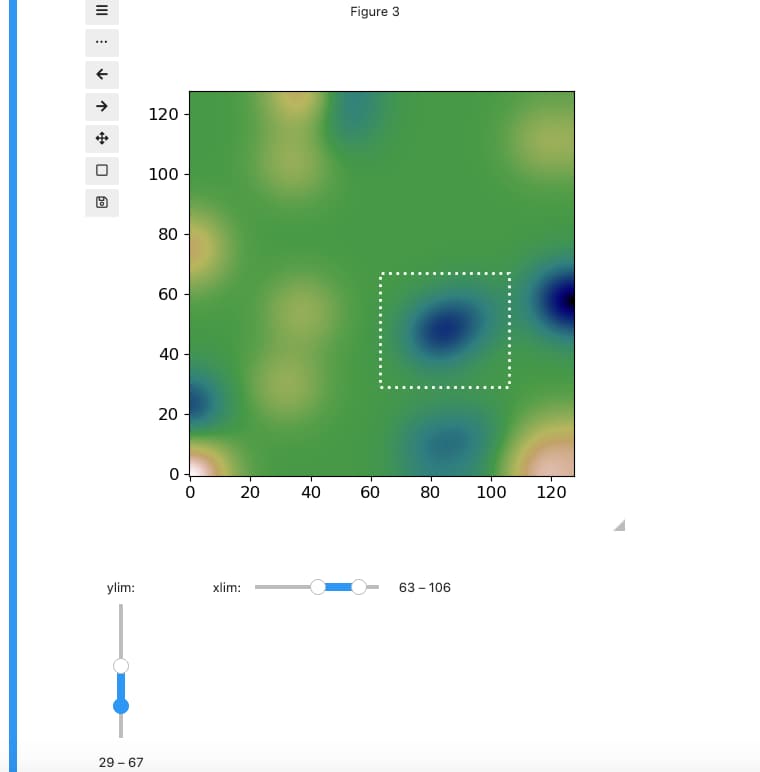
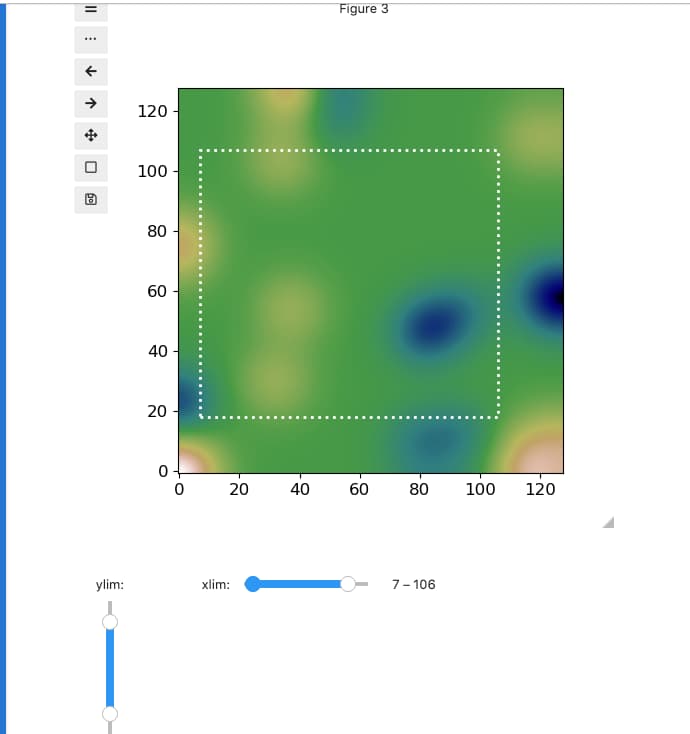
x_lim、y_limを変化させたときの画像の変化


参考
Using Interact — Jupyter Widgets 8.1.5 documentation
https://ipywidgets.readthedocs.io/en/latest/examples/Widget%20List.html
コメント