 matplotlib 3D
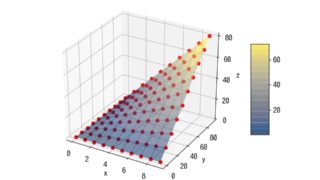
 [matplotlib 3D] 55. 3つのデータの関係性を3D surface plotで可視化
Matplotlibの3Dサーフェスプロットを使って3次元データを視覚的に表現する方法を解説します。複雑なデータの関係性を理解しやすくする表示技術と、欠損値のある場合の処理方法についても詳しく紹介しています。データ分析や科学研究に役立つ可視化テクニックが学べます。
matplotlib 3D  matplotlib 3D
  matplotlib 3D
  matplotlib
  matplotlib 3D
 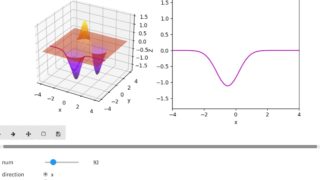 ipywidgets
  matplotlib 3D
  matplotlib 3D