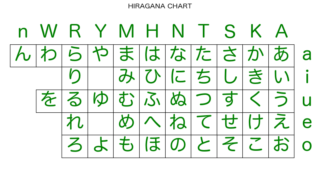
matplotlib

matplotlib

[matplotlib] 90. ラベルの位置の調整(ax.set_xlabelのloc)

matplotlibでx軸, y軸の位置を調整する方法について説明する。
matplotlib

[matplotlib] 89. 図中に任意の傾きの線を表示する(axline)

matplotlibで図全体に表示される任意の傾きの線を表示する方法について説明する。
ipywidgets

[ipywidgets] 30. 3Dプロットのアスペクト比をIntSliderで調整(set_box_aspect)

ipywidgetsのIntSliderをつかって、matplotlibの3Dプロットのアスペクト比をインタラクティブに変更する方法について説明する。
matplotlib

[matplotlib] 88. 強調線(集中線)

matplotlibで強調線を表示する方法について説明する。
matplotlib

[matplotlib animation] 86.円の接線のアニメーション

matplotlibのFuncAnimationで円の接線を表示するアニメーションを作成する。
matplotlib

[matplotlib animation] 85.様々な形状と色をもつ楕円をランダムに表示

matplotlibのFuncAnimationとmatplotlib.patches の Ellipseで様々な形状と色をもつ楕円をランダムに表示するアニメーションを作成する。
matplotlib

[matplotlib] 87. ベジェ曲線

matplotlibで2次、3次のベジェ曲線を表示する方法について説明する。
matplotlib

[matplotlib] 86. 極座標棒グラフ(projection=’polar’ & bar)

matplotlibで極座標の棒グラフを表示する方法について説明する。