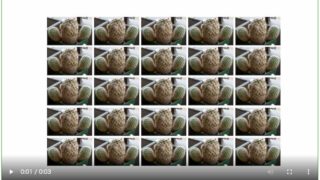
matplotlib [matplotlib animation] 85.様々な形状と色をもつ楕円をランダムに表示 matplotlibのFuncAnimationとmatplotlib.patches の Ellipseで様々な形状と色をもつ楕円をランダムに表示するアニメーションを作成する。 2020.07.26 matplotlibmatplotlib Animationpython
matplotlib [matplotlib] 86. 極座標棒グラフ(projection=’polar’ & bar) matplotlibで極座標の棒グラフを表示する方法について説明する。 2020.07.15 matplotlibpython
matplotlib [matplotlib animation] 84.うずまき matplotlibのFuncAnimationとprojection='polar'でうずまきのアニメーションを表示する。 2020.07.11 matplotlibmatplotlib Animationpython
matplotlib [matplotlib] 85. 積み上げ面グラフ(matplotlib stackplot) matplotlibのstackplotで積み上げ面グラフを表示する方法を例を示して説明する。 2020.07.10 matplotlibpython
matplotlib [matplotlib] 84. binの形状を六角形とした2次元ヒストグラムを表示(matplotlib hexbin) matplotlibのhexbinでbinの形状を六角形とした2次元ヒストグラムを表示する方法について説明する。 2020.07.10 matplotlibpython
ipywidgets [ipywidgets] 29. 図上の任意の位置にインタラクティヴに矢印を表示(matplotlib.patches FancyArrowPatch) ipywidgetsのFloatSliderをつかって、matplotlib patchesのFancyArrowPatchで表示する矢印をプロット上の任意の位置に表示する方法について説明する。 2020.07.08 ipywidgetsmatplotlibpython
matplotlib [matplotlib] 83. 図上に矢印を表示(matplotlib.patches FancyArrowPatch, Arrow) matplotlibのpatchesの、FancyArrowPatch、Arrowでプロット上に矢印を表示する方法について説明する。 2020.07.08 matplotlibpython