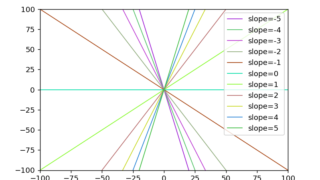
python

matplotlib

[matplotlib] 84. hexbin関数を使用して六角形ビンによる2次元ヒストグラムを表示する方法

matplotlibのhexbin関数を使用して、binの形状を六角形にした2次元ヒストグラムを描画する方法を解説します。データ分布の可視化や密度推定において、六角形binは四角形binよりも等方的な表現が可能で、データ分析に役立ちます。
ipywidgets

[ipywidgets] 29. 図上の任意の位置にインタラクティヴに矢印を表示(matplotlib.patches FancyArrowPatch)

matplotlib.patches FancyArrowPatchを使用して、インタラクティブに図上の任意の位置に矢印を表示する方法について解説します。ipywidgetsのFloatSliderを組み合わせることで、ユーザーが矢印の位置や角度を動的に調整できる機能を実装する手順を紹介します。
matplotlib

[matplotlib] 83. 図上に矢印を表示(matplotlib.patches FancyArrowPatch, Arrow)

matplotlibのpatchesの、FancyArrowPatch、Arrowでプロット上に矢印を表示する方法について説明する。
ipywidgets

[ipywidgets] 28. Dropdown, Selectで画像を任意のcmapで表示

jupyter notebookの対話的にパラメータを調整できる機能(ipywidgets DropdownおよびSelect)で、画像を任意のcmapで表示する方法について説明する。
matplotlib

[matplotlib] 82. マウスイベントで画像上の任意の位置に四角を表示

matplotlibのbutton_press_event、button_release_event、motion_notify_eventで、画像の任意の位置に四角をインタラクティブに表示する方法について説明する。
ipywidgets

[ipywidgets] 27. IntRangeSliderで画像の任意の範囲のヒストグラムを表示

jupyter notebookの対話的にパラメータを調整できる機能(ipywidgets IntRangeSlider)で、画像の任意の位置のヒストグラムをインタラクティブに表示する方法について説明する。
ipywidgets

[ipywidgets] 26. IntRangeSliderで画像の任意の位置に四角を表示

jupyter notebookの対話的にパラメータを調整できる機能(ipywidgets IntRangeSlider)で、画像の任意の位置に四角をインタラクティブに表示する方法について説明する。
ipywidgets

[ipywidgets] 25. 卵状構造をとる2つの球の任意の高さにおける断面を表示

jupyter notebook, labで対話的な操作ができる機能(ipywidgets)のFloatSliderをつかって、3Dグラフの任意の高さにおける断面図を表示する方法について説明する。