 matplotlib Animation
 [matplotlib animation] 49. 区分的アフィン変換のアニメーション
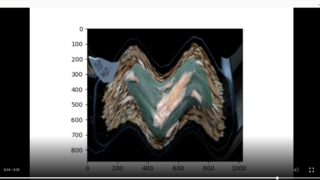
matplotlibとscikit-imageを使用して区分的アフィン変換によるアニメーションを作成する方法を解説。PiecewiseAffineTransformとwarp関数の活用法から実装例まで、画像変形アニメーションの基本を学べます。
matplotlib Animation 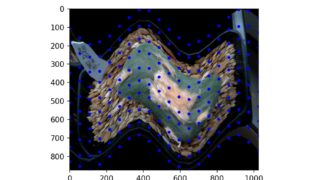 python
 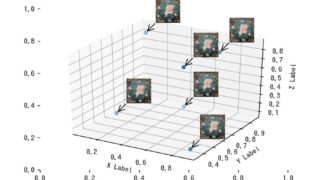 matplotlib 3D
 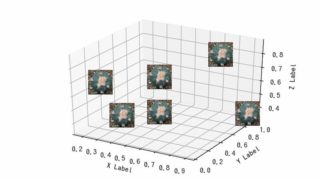 matplotlib 3D
  matplotlib 3D
  matplotlib 3D
  matplotlib 3D
 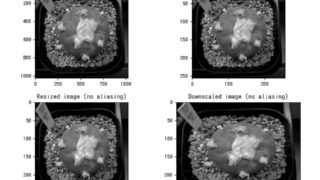 python