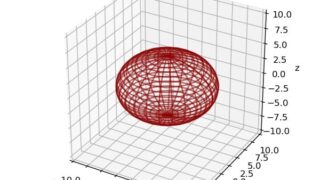
matplotlib Animation [matplotlib animation] 8. 3Dグラフの軸範囲更新アニメーション matplotlibのFuncAnimationを使用した3Dグラフの軸範囲更新アニメーションの作成方法を解説。コード例を交えながら、視点変更や表示範囲の動的更新による効果的なデータ可視化テクニックを紹介しています。 2018.12.03 matplotlib Animationpython
matplotlib 3D [matplotlib Animation] 7. 双曲面の拡張アニメーション このページでは、matplotlib FuncAnimationを用いた双曲面の拡張アニメーションについて説明します。3Dグラフの動的な表示方法や、双曲面を徐々に変形させる技術を解説しています。Pythonでの数学的可視化に役立つ内容です。 2018.12.03 matplotlib 3Dmatplotlib Animationpython
matplotlib 3D [matplotlib 3D] 38.双曲面(Hyperboloid) このページでは、matplotlibのmplot3dを使用して双曲面(Hyperboloid)をグラフ化する方法を解説します。3次元空間における双曲面の数学的表現と実装例を通じて、視覚的に美しい数学モデルの作成方法を学びましょう。 2018.12.02 matplotlib 3Dpython
matplotlib 3D [matplotlib 3D]37. 円錐(Cone)の作成方法 Pythonのmatplotlibを使った3D円錐の描画方法を解説。基本からカスタマイズ、複数円錐の組み合わせまで、視覚的に魅力的な3Dグラフ作成のテクニックを紹介します。 2018.12.02 matplotlib 3Dpython
matplotlib Animation [matplotlib animation] 6.正規分布(ガウス分布)のアニメーション matplotlibのFuncAnimationを使った正規分布(ガウス分布)のアニメーション作成方法を解説。平均値と分散の変化を動的に可視化し、統計概念の理解を深めるための具体的な実装例を提供します。 2018.11.29 matplotlib Animationpython
matplotlib 3D [matplotlib 3D] 36. 回転放物面体の描画 matplotlibのmplot3dモジュールを使用して数学的に定義された回転放物面体を3D表示する方法を解説。Pythonコードでの実装手順とパラメータ調整による視覚効果の変化を詳細に紹介。 2018.11.28 matplotlib 3Dpython
matplotlib 3D [matplotlib 3D] 35. 円柱(円筒座標) matplotlib mplot3dで円柱(シリンダー)を3次元表示する方法を解説します。円筒座標系を使ってデータを生成し、3Dグラフ上に表現する手順と実装方法を紹介します。 2018.11.26 matplotlib 3Dpython