Rotation animation of 3D graph
Code
Since this version does not work well on jupyter notebook, I rewrite it using by FuncAnimation.
Code (using FuncAnimation)
Explanation
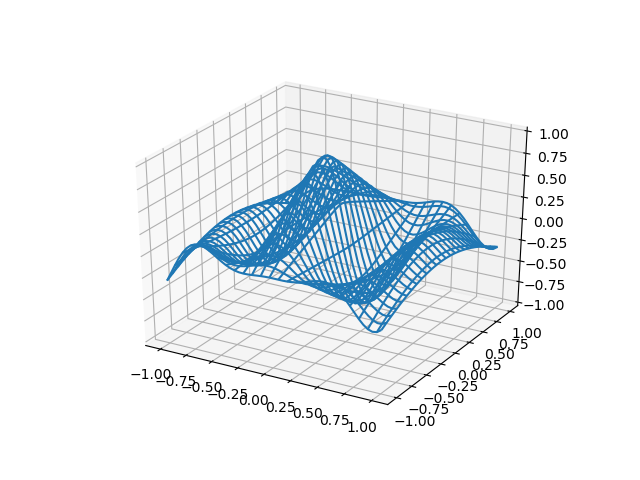
Test data was loaded.
This is the setting of the animation graph to display first.
This is a setting of animation, setting to change viewpoint.
elev is an abbreviation for Elevation viewing angle, setting the height of the viewpoint. (default = 30).
azim is an abbreviation for Azimuthal viewing angle, setting the azimuth angle. (default = -60).
fig is a figure object that displays animation.
animate is a function related to animation, which is set to rotate horizontally by 3.6 °.
init_func is the setting of fig initialization.
frame is the number of frames of the entire animation.
interval is the display interval, interval is 100 [ms] and frames is 100, it is animation of 10 [s].
If blit is set to True, animation will be optimized and it will not be stiff.
Output ani as HTML5 video.
When blit = False
Although image quality improves, the file is heavy. (1.1 M)
Hide axis and grid
The grid disappears with grid (False), the axis disappears with set_axis_off ().
Reference


コメント