ヘリング錯視とは
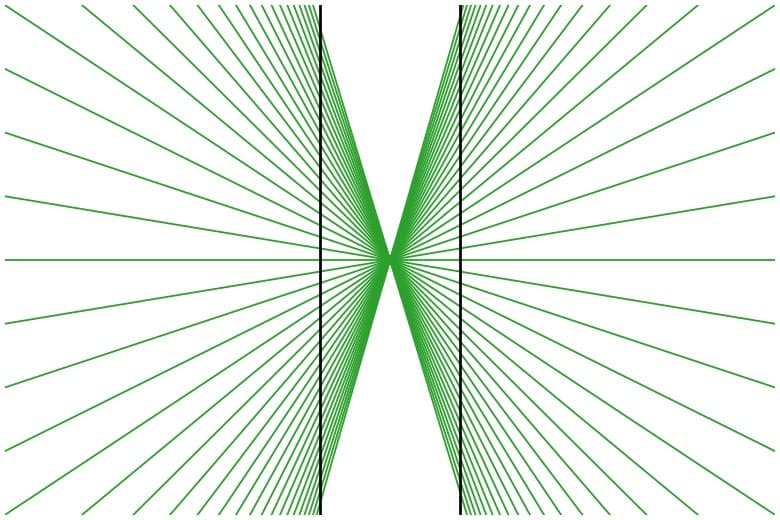
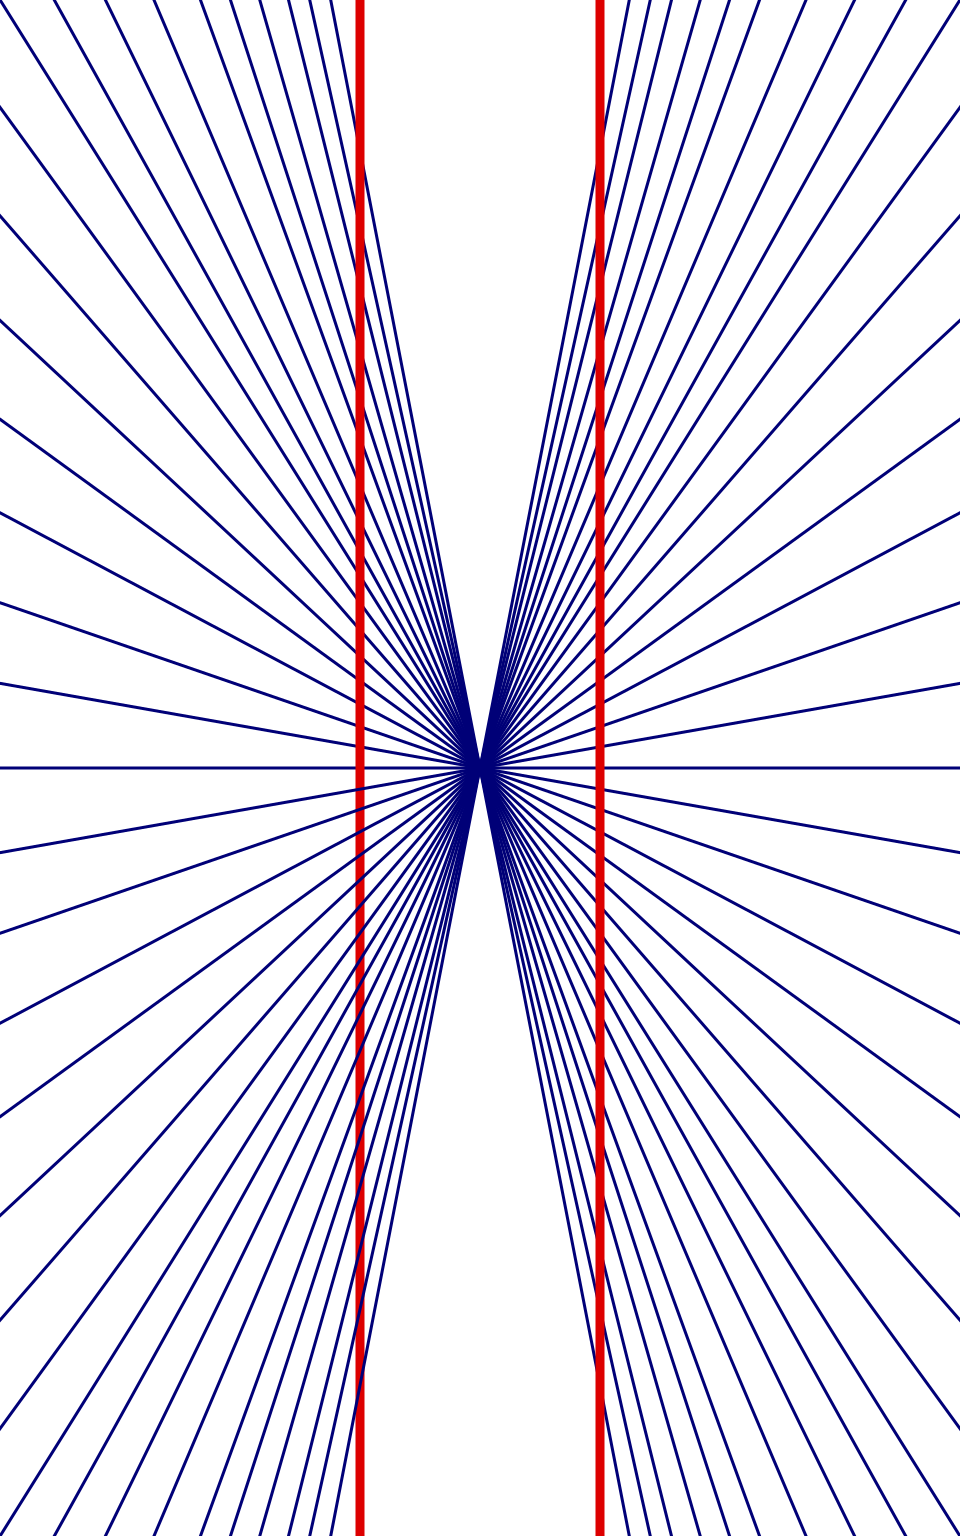
ヘリング錯視は、放射状の線の背景に置かれた平行な直線が、実際には平行であるにもかかわらず、中央部分で外側に湾曲して見える現象です。この錯視は、背景の放射線が生み出す遠近感によって引き起こされます。
仕組み
この錯視が生じる理由は、人間の視覚システムが背景の放射状のパターンを奥行きの手がかりとして解釈するためです。脳は放射線を「遠近法」のように処理し、平行線に歪みを感じさせます。
Pythonによる実装
この記事では、Pythonのmatplotlibライブラリを使用してヘリング錯視を再現する方法を紹介します。
コード
解説
モジュールのインポート
バージョン
任意の傾きの直線を表示
axlineを使用して座標(x,y)=(0,0)を通る直線を作成します。slopeにiの値を設定し、リスト内包表記のfor文を用いて複数の直線を効率的に表示します。
垂線の表示
axvline を使用して、x=0.01と-0.01の位置に黒い垂直線を描画します。
figの保存
パラメータbbox_inches=0、pad_inches=0 を設定し、図の作成時にconstrained_layout=True とすることで、余白のない画像データとして保存できます。
参考
ヘリング錯視 - Wikipedia
ja.wikipedia.org

matplotlib.pyplot.axline — Matplotlib 3.10.8 documentation
matplotlib.org

matplotlib.pyplot.axvline — Matplotlib 3.10.8 documentation
matplotlib.org

コメント