はじめに
この記事では、Jupyter Notebookの対話型ウィジェット機能を活用して、3D空間上のデータを直感的に探索する方法を解説します。特に、RadioButtonsとIntSliderの組み合わせによる効果的なデータ可視化テクニックに焦点を当てています。
コード

解説
このコードは前回の投稿のコードを改変したものです。そのため、本記事では変更点のみを解説します。
[ipywidgets] 6. RadioButtonsでデータを取得する方向を選択して、IntSliderで画像の任意の位置のデータをラインで表示
Jupyter notebookでipywidgetsのRadioButtonsとIntSliderを使って、画像データから任意の方向・位置のラインデータを対話的に抽出・可視化する方法を解説。データ分析の効率と直感性を高めるテクニックを紹介。
sabopy.com
2019.08.06
3Dグラフの設定
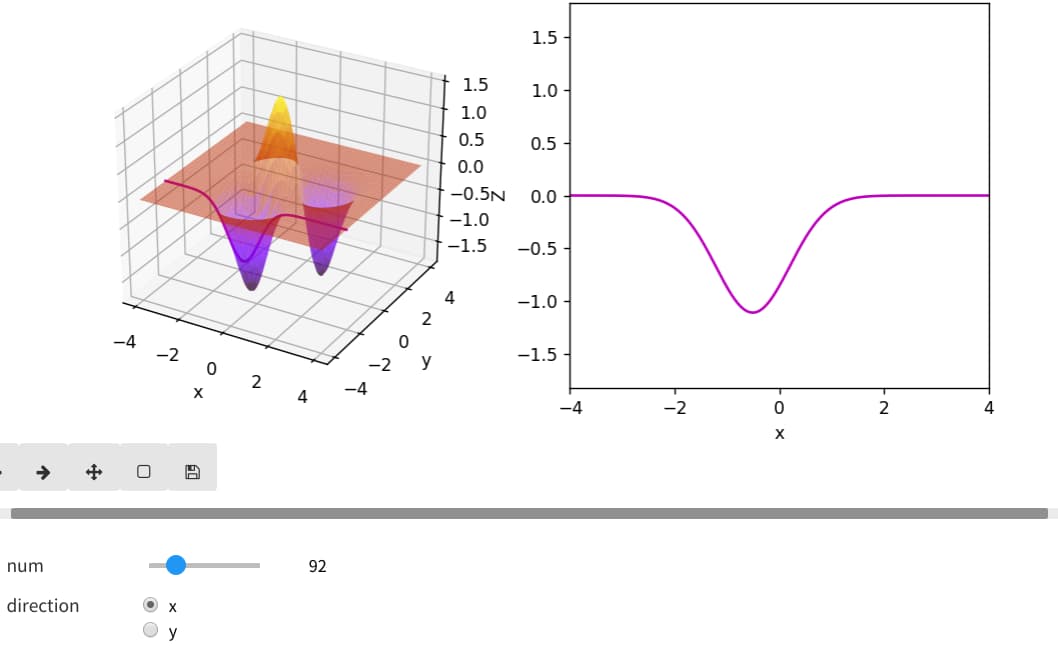
データをplot_surface関数で表示し、軸線(axhline、axvline)ではなく、通常のplot関数を使用してラインを描画します。
ipywidgetsの設定
3Dグラフにデータを設定する際、set_zdata()を使うと予想されるかもしれませんが、実際にはset_3d_properties()メソッドを使ってzデータを設定します。
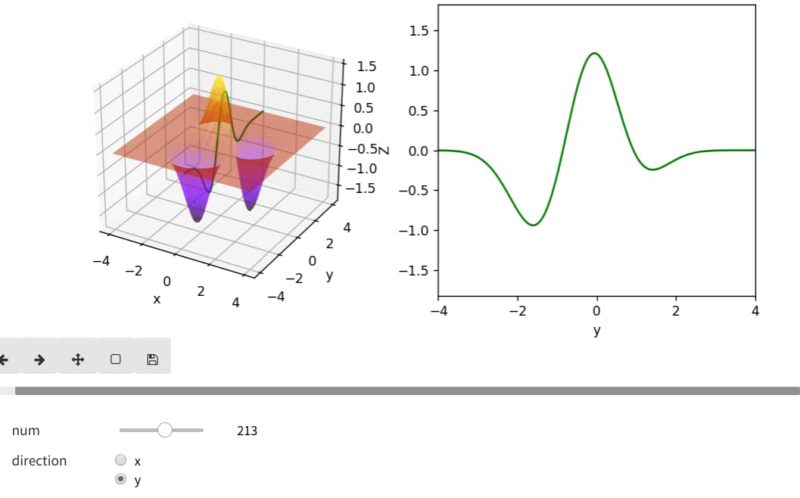
ラジオボタンをyにしたときの図
参考


Jupyter Widgets — Jupyter Widgets 8.1.8 documentation
ipywidgets.readthedocs.io
コメント