はじめに
この記事では、matplotlib ライブラリを使用してプロットの見た目を変更するためのスタイル設定方法について解説します。デフォルトスタイルの変更、カスタムスタイルの適用、プロットのパーソナライズ方法などを紹介します。
解説
モジュールのインポート
適当なplotの作成
スタイルの適用
plt.style.use(‘スタイル名’)を使用するとスタイルが適用され、プロットの見た目が変化します。スタイルの適用はfigを作成する前に行うことで、プロットに正しく反映されます。
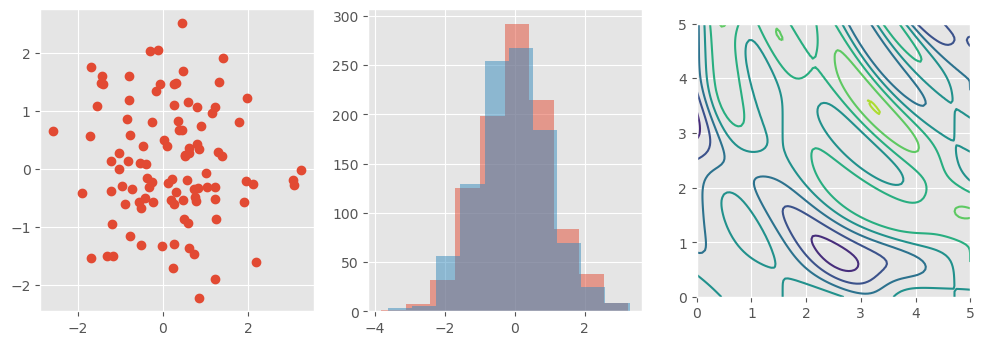
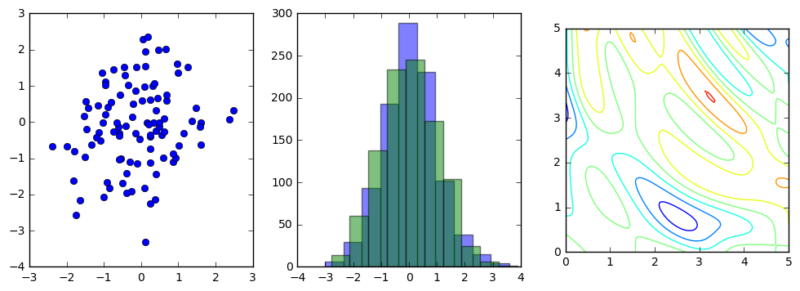
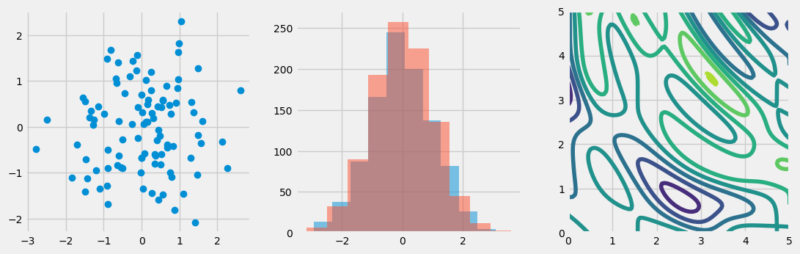
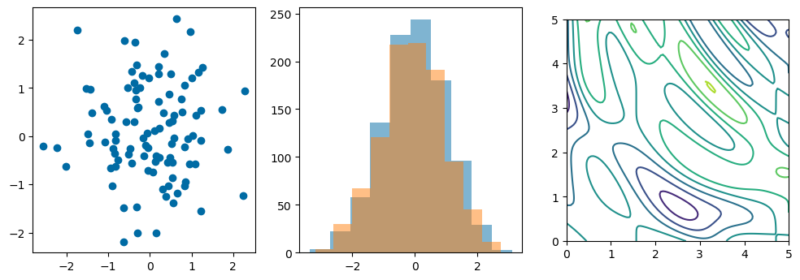
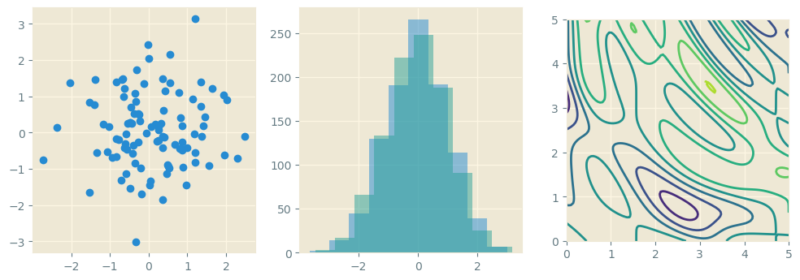
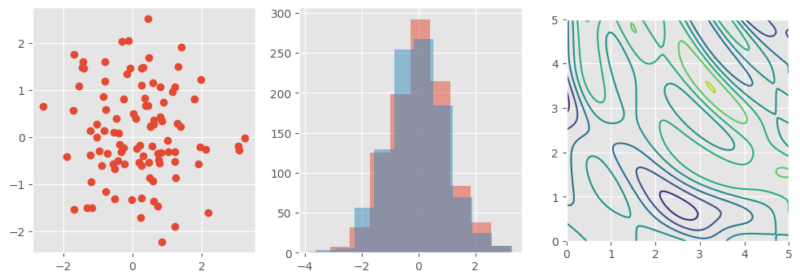
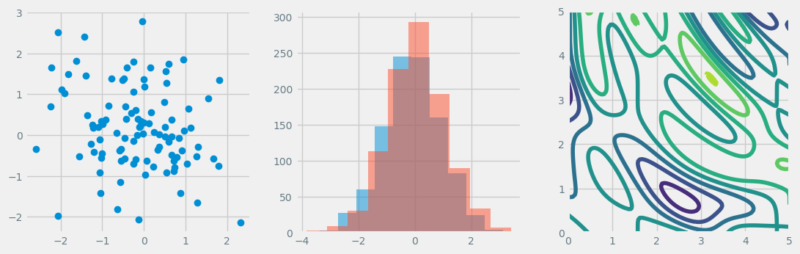
図の見た目はスタイル設定によって簡単に変更できます。以下にその例を示します。
plt.style.use(‘classic’)
plt.style.use(‘fivethirtyeight’)
plt.style.use(‘tableau-colorblind10’)
plt.style.use(‘Solarize_Light2’)
plt.style.use(‘ggplot’)
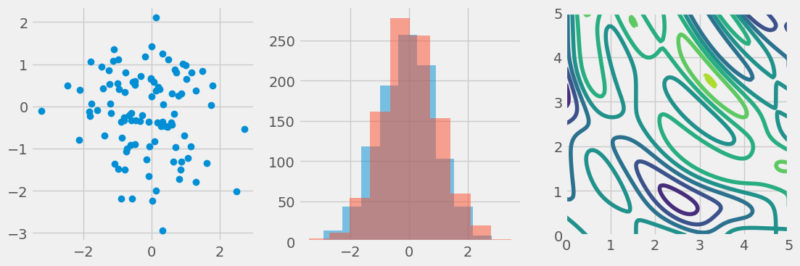
スタイルを2重で設定
複数のスタイルを指定すると、それらが組み合わさった混合スタイルとして適用されます。
ggplot + fivethirtyeight
fivethirtyeight + Solarize_Light2
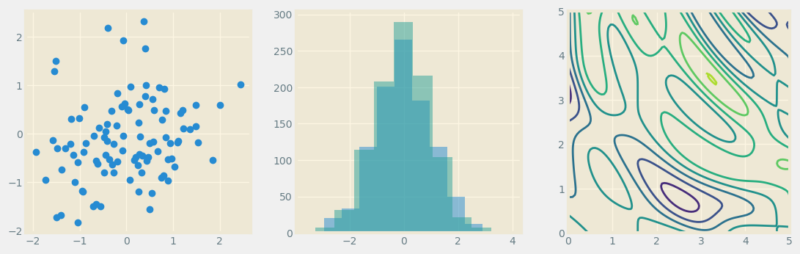
Solarize_Light2 + fivethirtyeight
スタイルを指定する順序によっても見た目が変化します。
まとめ
matplotlibのスタイル設定を活用することで、データ可視化の質を大きく向上させることができます。この記事で紹介した方法を使えば、プロットの見た目を簡単にカスタマイズでき、より効果的なデータ表現が可能になります。目的に合わせて適切なスタイルを選択し、魅力的なデータビジュアライゼーションを作成しましょう。
参考


Style sheets reference — Matplotlib 3.1.0 documentation
matplotlib.org
コメント