はじめに
データ可視化において凡例(legend)の表示順序は、読み手の理解しやすさに大きく影響します。この記事では、matplotlib を使って凡例の順序を逆にする方法を詳しく解説します。
本記事で学べること
- legend() 関数の reverse パラメータを使った簡単な方法
- ハンドルとラベルを手動でソートする高度なテクニック
- 実際のケースに基づいた実践的なコード例
- 凡例の位置や色、スタイルのカスタマイズ方法
コード&解説
モジュールのインポートなど
バージョン
データの生成
np.random.random(len(x))でランダムデータを作成します。
ax.legend()で凡例を表示
ax.legend()で凡例を表示すると以下のようになります。
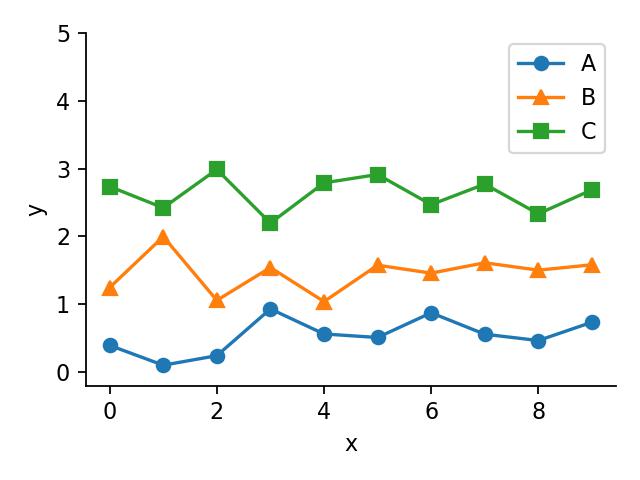
プロット上では線がC、B、Aの順に表示されているのに対し、凡例では上からA、B、Cと表示されています。データ自体を変更できない場合、凡例の順序を逆にして表示したくなるのは自然なことです。
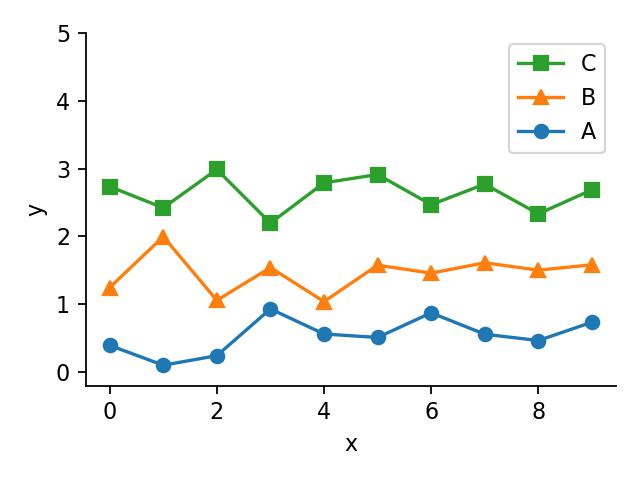
凡例を逆順にして表示
axオブジェクトにプロットしたグラフから、ax.get_legend_handles_labels()メソッドで凡例情報を取得できます。handlesにはプロットの形状が、labelsにはラベル情報が格納されます。
凡例を逆順に表示するには、ax.legend(handles=handles[::-1], labels=labels[::-1])のように、handlesとlabelsの両方を[::-1]で逆順に指定します。
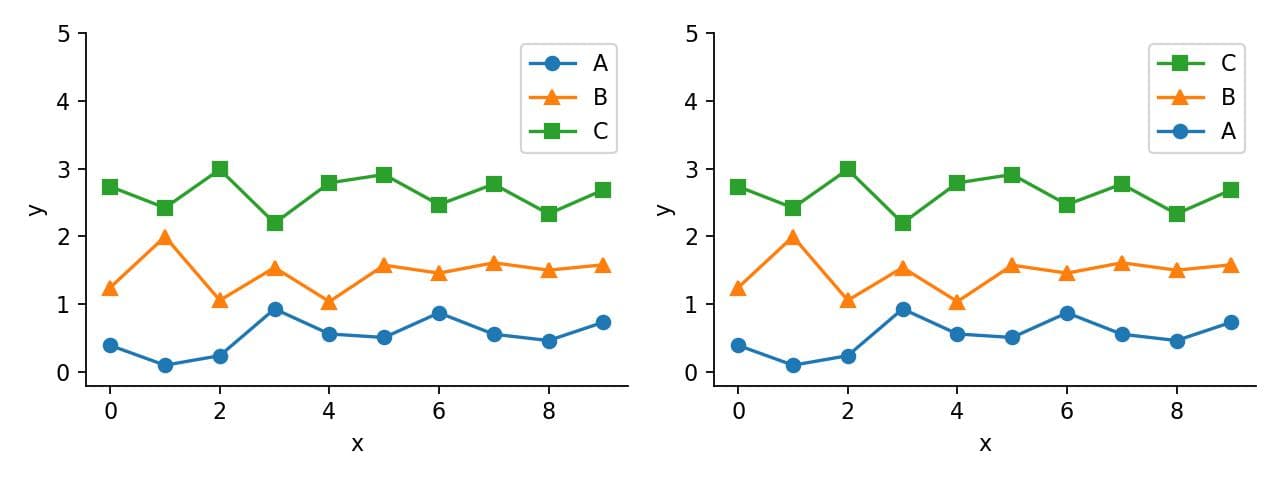
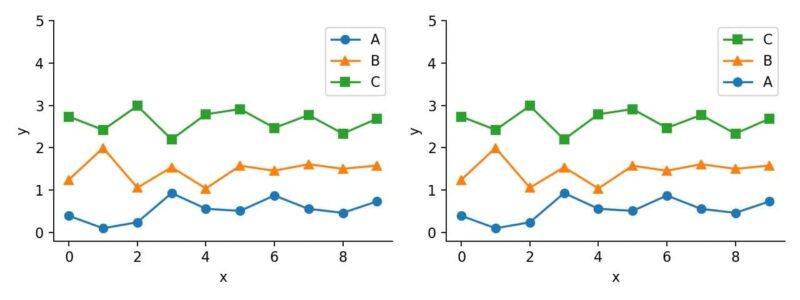
2つ並べて表示
横に並べて表示すると以下のようになります。
参考

matplotlibの凡例(legend)レイアウト関連メモ - Qiita
凡例の表示、曲線の選択 ax.legend()にオプションを何も含めない場合。 import matplotlib.pyplot as plt import numpy as np x = np.linspace(-3, 3, 101) y...
qiita.com

コメント