はじめに
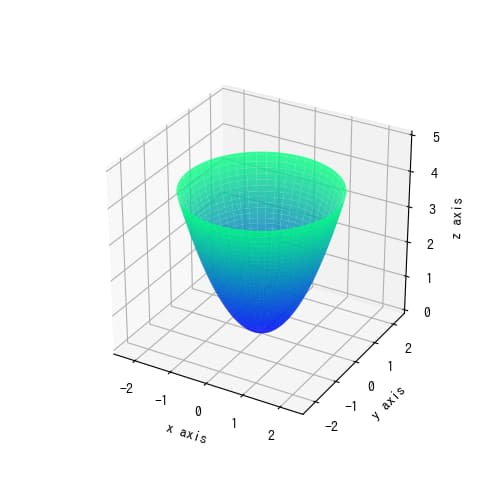
この記事では、matplotlibのmplot3dモジュールを使用して回転放物面体を3Dグラフとして描画する方法について解説します。数学的に表現された回転放物面の方程式をPythonコードで実装し、視覚的に表現する手順を紹介します。
コード
解説
モジュールのインポート
from matplotlib import cm
from mpl_toolkits.mplot3d import Axes3D
import matplotlib.pyplot as plt
import numpy as np
3Dグラフにする設定
fig=plt.figure(figsize=(6,6)
ax = fig.gca(projection='3d')
データ生成
theta = np.linspace(0, 2*np.pi, 100)
r = np.linspace(0, 2, 100)
t,R =np.meshgrid(theta, r)
X = R*np.cos(t)
Y = R*np.sin(t)
Z = R**2
角度(theta)と半径(r)を用いてmeshgridを作成します。X, Yは極座標なので、
となります。
回転放物面は
$$z=x^2+y^2$$とあらわせられるので、以下のようになります。
$$z=(rcos\theta)^2+(rsin\theta)^2 = r^2(cos^2\theta+sin^2\theta)=r^2$$プロットの作成
ax.plot_surface(X, Y, Z,alpha=0.8, cmap=cm.winter)
冬をイメージした「cmap=cm.winter」カラーマップを使用して表示します。[1]また、「alpha=0.8」を設定することで透明度80%(1が完全不透明)のsurfaceグラフを作成します。
軸ラベル、軸範囲の設定
ax.set_xlabel('x axis')
ax.set_ylabel('y axis')
ax.set_zlabel('z axis')
ax.set_xlim(-2.5,2.5)
ax.set_ylim(-2.5,2.5)
ax.set_zlim(0,5)
#ax.set_aspect('equal')
コードをダウンロード(.pyファイル)
コードをダウンロード(.ipynbファイル)
コメント
[…] [matplotlib 3D] 36. 回転放物面体matplotlib mplot3dによる回転放物面sabopy.com2018.11.28 (adsbygoogle = window.adsbygoogle || []).push({}); […]