
はじめに
この記事は、matplotlibのimshow関数を使用して画像の一部だけをカラーで表示する方法について解説しています。モノクロ画像の特定領域をカラーで強調表示するテクニックが紹介されています。
コード
解説
モジュールのインポート
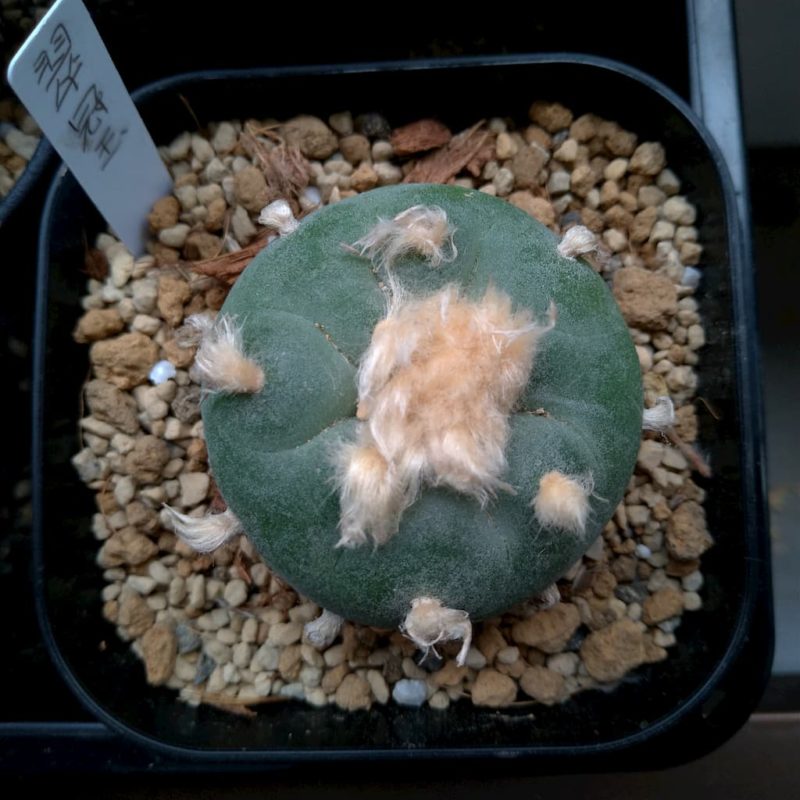
画像の読み込み
この画像を読み込みます。
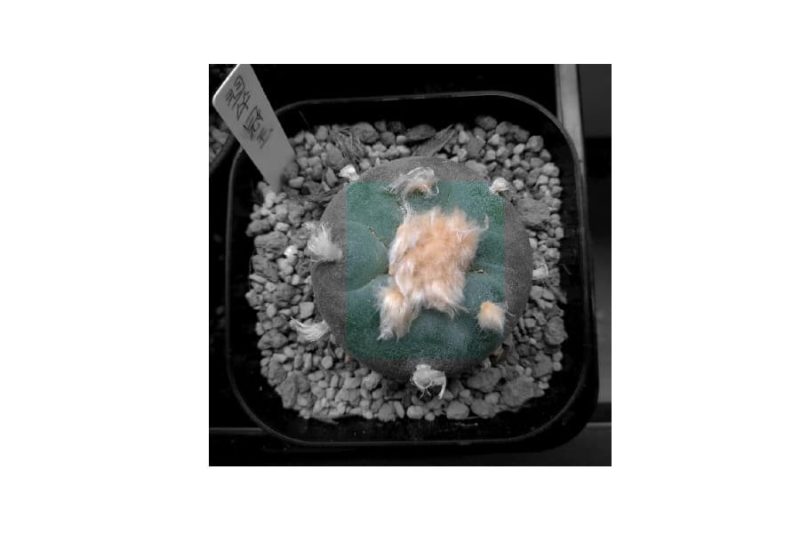
カラー画像の作成
中心部分以外を0とした画像データとします。
グレースケール画像の作成
rgb2grayによって画像が1次元化されるため、np.appendをaxis=2で2回適用することで同一データを3次元化します。その後、3次元化したデータの中心部分を0に設定します。
画像を足して表示
参考

matplotlib.pyplot.imshow — Matplotlib 3.10.8 documentation
matplotlib.org
[matplotlib] 24. 画像の表示、保存、画像処理について
Pythonのmatplotlibライブラリを使った画像の読み込み、表示、処理、保存方法について解説します。imshowメソッドの使い方や画像データの操作など、プログラミング初心者にもわかりやすく説明しています。
sabopy.com
2019.03.18
コメント