はじめに
Voxel(ボクセル)とは、3次元空間における「体積要素」を表す概念で、2次元画像のピクセルを3次元に拡張したものです。matplotlibでは、これらの3次元データを視覚的に表現し、アニメーション化することができます。
アニメーション
コード
解説
モジュールのインポート
3Dグラフの設定
座標データの生成
np.indices()関数を使用して、形状(10,10,10)の配列を作成します。この配列は各要素の位置にそのインデックス値を格納しています。
アニメーションの設定
ax.cla()で古いボクセルグラフを消去します。この操作ではラベルも消えるため、毎回ax.set_xlabel()などでラベル名を再設定する必要があります。
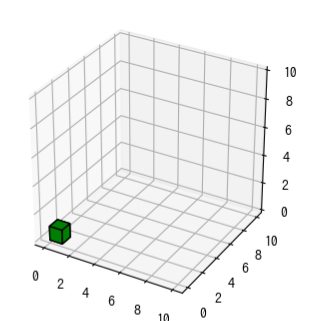
ボクセルは配列内のTrue位置にのみ表示されます。 voxels = (x < num+1) & (y < num+1) & (z < num+1) & (x > num-1) & (y > num-1) & (z > num-1) という式を使うと、Trueの位置が(0,0,0)、(1,1,1)、(2,2,2)と順に変化し、3Dグラフ上でボクセルが移動するアニメーションが生成されます。
アニメーションの表示
FuncAnimationを使用してアニメーションを表示します。10ステップのupdateを実行してアニメーションを生成します。intervalが100msに設定されているため、全体で1秒のアニメーションとなります。jupyter notebook上では、HTML(ani.to_html5_video())を使用してアニメーションを直接表示できます。
膨張アニメーション
コード
解説
アニメーションの設定
voxels = (x < 11+num) & (y < num+11) & (z < num+11) & (x > 9-num) & (y > 9-num) & (z > 9-num)のように条件を設定することで、(10,10,10)の位置から周囲に1個ずつボクセルが増えていくアニメーションができる。
積み上げアニメーション
コード
解説
アニメーションの設定
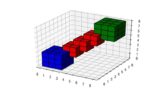
上記を参考にして、各ボクセルに異なる色を適用したアニメーションも作成できます。
参考


コメント