はじめに
この記事では、matplotlibのFuncAnimationを使用して3次元空間でのランダムウォークアニメーションを作成する方法を解説しています。主なポイントは以下の通りです:
- 3次元空間での確率的な動きを視覚化する技術
- Pythonのmatplotlibライブラリを活用した動的グラフ作成
- 物理現象(ブラウン運動)のシミュレーション方法
この記事を通じて、科学的データの動的な可視化技術を習得することができます。
コード
解説
モジュールのインポート
3Dグラフを作成するためにmpl_toolkits.mplot3d をインポートします。
バージョン
データの生成
3次元のx,y,zデータを極座標系で媒介変数によって生成します。この生成方法は以下のコード例でも使用しています。
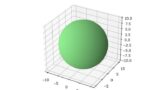
まず、x, y, zの座標をvstackでひとまとめにし、.Tで転置します。
次に、np.linalg.norm()にaxis=1を指定して各行のノルム(ベクトルの長さ)を計算します。
そのノルムで各要素を割ることで、各行のベクトルを規格化(正規化)します。
np.vstack(([[0,0,0]], xyz))を使って、スタート地点を原点[0,0,0]に設定します。
ランダムウォークの位置は、1Dや2Dの例と同様に、np.cumsum()で累積和を計算することで各ステップでの座標を取得します。
3次元のランダムウォークデータの表示
上記で作成したデータを表示すると以下のようになります。
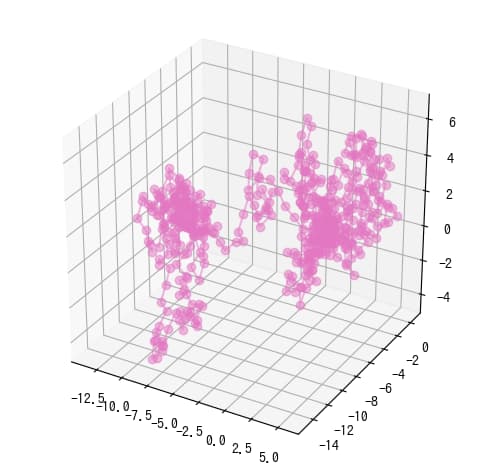
上の図のx軸、y軸、z軸の表示範囲をax.get_xlim(), ax.get_ylim(), ax.get_zlim()で取得します。
アニメーションの表示
まず、p1で空のプロットを作成し、そこにデータを流し込みます。x、yデータの設定には set_data メソッドを使用し、zデータの設定には set_3d_properties メソッドを使います。x軸、y軸、z軸の表示範囲は、ax.set(xlim=xlim, ylim=ylim, zlim=zlim) のように、先ほど取得した値を使って設定します。
animation.FuncAnimation を使って ani オブジェクトを作成し、このオブジェクトに対して HTML(ani.to_html5_video()) を実行することで、Jupyter Lab(および Notebook)上でアニメーションを表示できます。
コードをダウンロード(.pyファイル) コードをダウンロード(.ipynbファイル)参考


コメント