はじめに
3次元空間でのベクトル場の可視化は、物理学、流体力学、電磁気学などの分野で重要な役割を果たします。matplotlibのmplot3dモジュールにあるquiver関数を使うことで、これらのベクトル場を効果的に表現できます。
コード
解説
モジュールのインポート
データの生成
ここでx, y, zはベクトルの始点の座標を表します。
ベクトルの生成
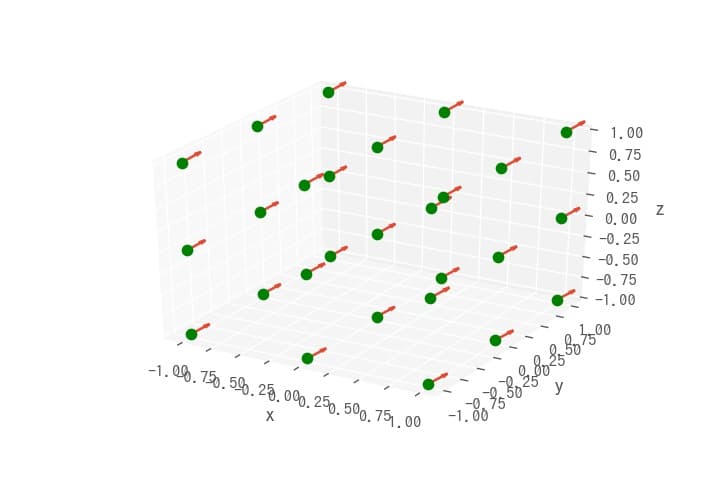
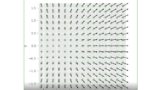
u, v, wはベクトル成分を表しています。これらの値によって、各ポイントに(0.1, 0.1, 0.1)方向へのベクトルが生成されることを示しています。
ベクトルの表示
ax.quiver(x, y, z, u, v, w)関数を使用すると、座標(x, y, z)から方向(u, v, w)へのベクトルを描画できます。3Dグラフを回転させると、以下のように表示されます。
データを変化させたときのベクトルグラフの変化
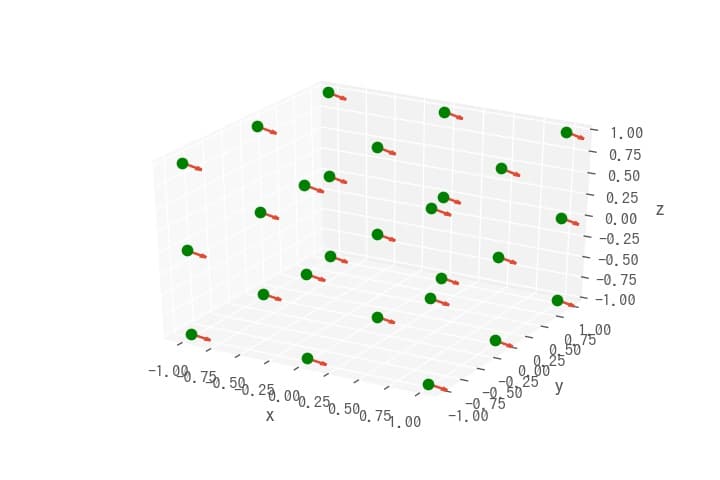
ベクトルが下を向いていることがわかる。回転させると以下のようになります。
3Dグラフの回転は以下の記事を参考にしました。
[matplotlib 3D] 14. 3Dグラフの回転アニメーション
matplotlibのmplot3dを使用して3Dグラフの回転アニメーションを作成する方法を解説します。動画として保存する手順や回転角度の制御など、3Dビジュアライゼーションを動的に表現するための基本テクニックを紹介します。
sabopy.com
2018.10.25
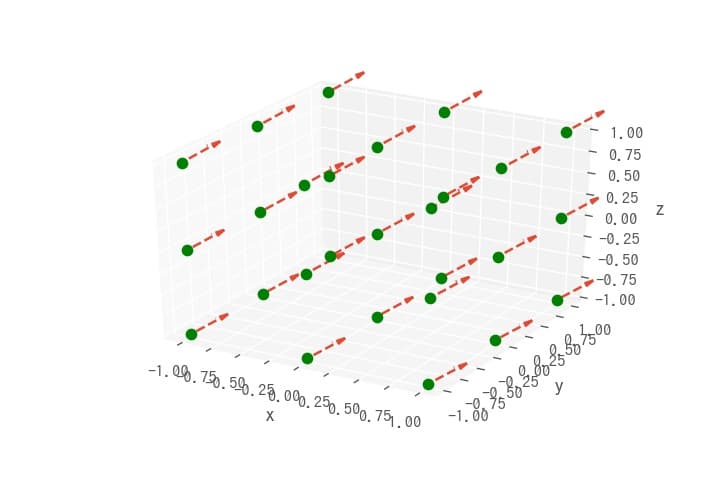
ベクトルを点線にする
ベクトルのアニメーション表示
下記記事で2Dグラフのベクトルのアニメーションについて解説しました。
[matplotlib animation] 92. quiverのアニメーション
matplotlibのFuncAnimationとquiver関数を組み合わせて、動的なベクトル場アニメーションを作成する方法を解説。物理現象や数学的な概念を視覚的に表現するための実践的なPythonコード例を提供します。
sabopy.com
2020.11.17
まとめ
matplotlibのquiver関数を使った3Dベクトル場の可視化は、複雑な物理現象や数学的概念を直感的に理解するための強力なツールです。適切なパラメータ調整とカラーマッピングを活用することで、情報量の多い視覚的な表現が可能になります。科学計算や物理シミュレーションの結果を効果的に伝えるために、これらの技術を活用しましょう。
参考


3D quiver plot — Matplotlib 3.1.0 documentation
matplotlib.org

matplotlib.pyplot.quiver — Matplotlib 3.1.0 documentation
matplotlib.org
コメント