
はじめに
3次元データの視覚化は、データ分析や科学研究において重要な役割を果たします。特に時間変化するデータセットを表現する場合、静的な画像では伝えきれない情報があります。MatplotlibのArtistAnimationを使用すると、3Dワイヤーフレームプロットに動きを加え、より直感的な理解を促進できます。
コード(matplotlib example)

上記ページのコードをjupyter notebookで実行した結果、
%matplotlib nbagg
Warning: Cannot change to a different GUI toolkit: nbagg. Using notebook instead.
とのことでアニメーションが表示されなかった。
%matplotlib notebook
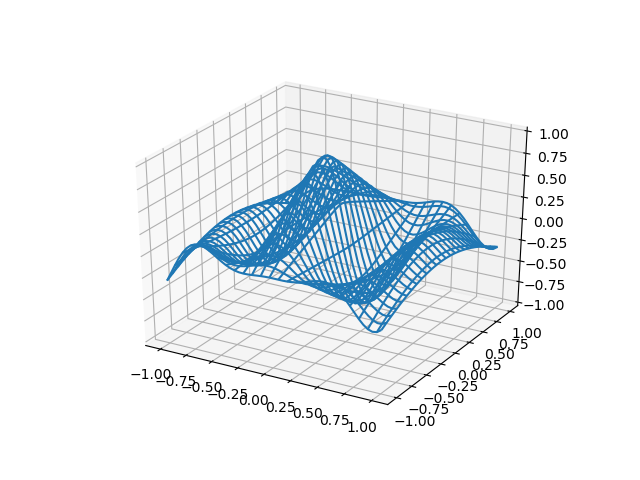
としてもアニメーションが表示されず、下の画像が表示された。
そこで、ArtistAnimationを活用して実装方法を改良しました。
コード&解説
モジュールのインポート
バージョン
データ生成関数
Zデータを生成する関数generateを以下のように定義します。
X, Y meshgridの作成
X,Yデータをnp.meshgridで作成します。
plot_wireframeでプロット
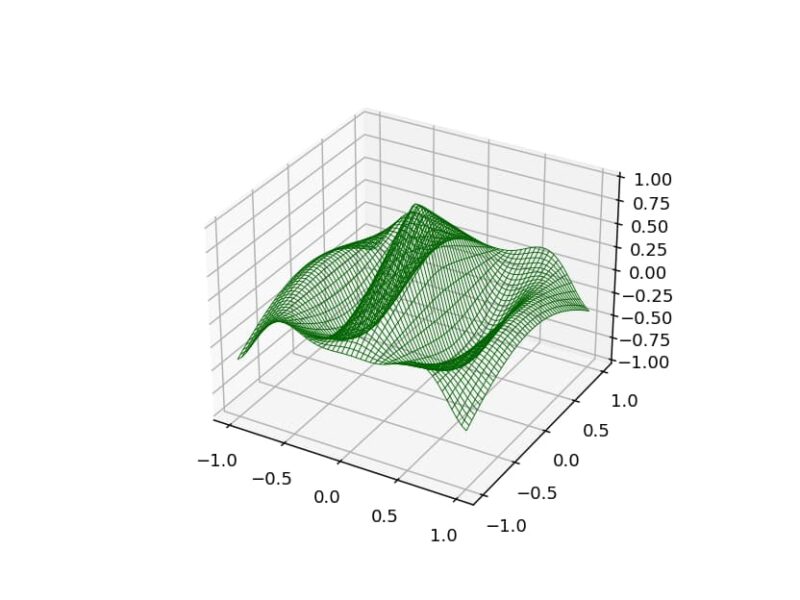
関数generateのphiを0とした時のデータをplot_wireframeで表示すると以下のようになります。
アニメーション用グラフの作成
まず、imsという空のリストを作成します。
次に、phiの0個目から50個目まで順にZのデータを生成し、wireframe関数でプロット(im)を作成します。
作成したimをimsリストに追加していきます。
このとき、imを[im]のように角括弧で囲むことがポイントです。
最終的に、imsはplot_wireframeオブジェクトのリストとなります。
アニメーションの表示
ArtistAnimationを使用してアニメーションを作成します。 figはアニメーションを表示する図であり、imsはグラフのリストです。intervalパラメータでは図の表示時間(ミリ秒)を設定します。 アニメーションはIPythonのHTML displayで表示でき、to_html5_video関数を使用してHTML5形式に変換できます。
作成されるアニメーションは以下のようになります。
参考


コメント