はじめに
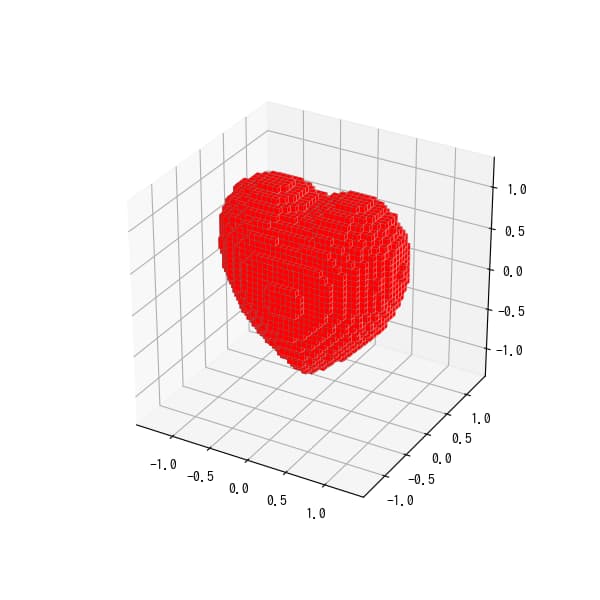
Matplotlibのmplot3dモジュールを使用して、3次元空間内にボクセル(3D空間のピクセル)でハート形状を描画します。さらに、そのハートを回転させるアニメーションも作成します。
コード
ハート
回転アニメーション
解説
モジュールのインポート
データの生成
データの生成については、下記のトーラスと同様にして生成しました。
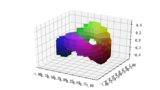
[matplotlib 3D] 31. トーラス(ドーナツ形状)を3Dボクセル表現する方法
matplotlib mplot3dモジュールのvoxel関数を使用してトーラス(ドーナツ形状)を3Dボクセルで表現する方法を解説します。3次元空間での数学的形状の視覚化とボクセルベースのレンダリング技術について学べるコンテンツです。
sabopy.com
2018.10.31
heartの3D形状は以下の式で表されます。[1]
$$(x^2 + \frac{4}{9}y^2+z^2-1)^3 -x^2z^3+ -\frac{9}{80}y^2z^3 = 0$$<0とすることでハートの部分だけボクセルを表示することができます。
ハートの表示
アニメーションの表示
アニメーションのコードは、wireframeの回転アニメーションと同じ構造になっています。
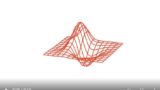
[matplotlib 3D] 14. 3Dグラフの回転アニメーション
matplotlibのmplot3dを使用して3Dグラフの回転アニメーションを作成する方法を解説します。動画として保存する手順や回転角度の制御など、3Dビジュアライゼーションを動的に表現するための基本テクニックを紹介します。
sabopy.com
2018.10.25
参考
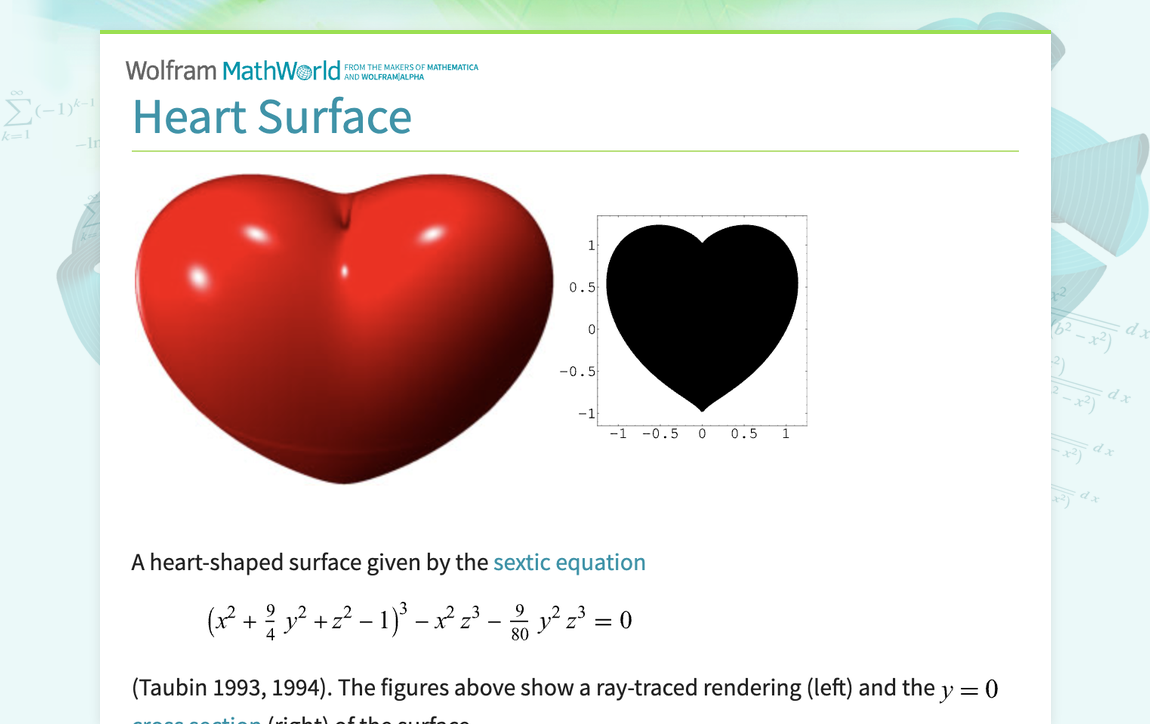
Heart Surface -- from Wolfram MathWorld
A heart-shaped surface given by the sextic equation (x^2+9/4y^2+z^2-1)^3-x^2z^3-9/(80)y^2z^3=0 (Taubin 1993, 1994). The ...
mathworld.wolfram.com

コメント