はじめに
この記事では、scikit-imageライブラリを使用してグレースケール画像をバイナリ画像(2値画像)に変換するためのしきい値処理手法について解説しています。特にOtsuのアルゴリズムを用いた自動しきい値決定方法や、様々な閾値設定テクニックをPythonのコード例とともに紹介します。画像処理やコンピュータビジョンの基礎技術を学びたい方に役立つ内容となっています。
コード

解説
モジュールのインポート
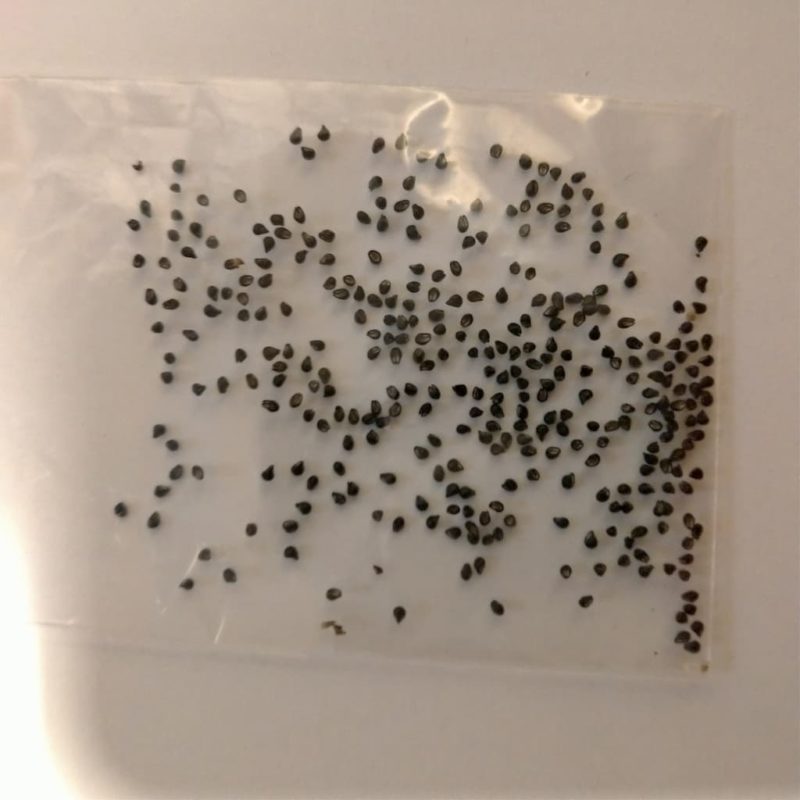
画像データの読み込み
Epithelantha属の月世界の種子を使用し、rgb2gray関数によってグレースケール画像に変換します。
大津の2値化によるしきい値処理
threshold_otsu(image)関数を使用すると、画像に大津の方法を適用した際の最適なしきい値を取得できます。このしきい値を用いて「image > thresh」のように条件式を適用すると、TrueとFalseで構成されるバイナリ画像が生成されます。不等号を「>」から「<」に変更すると、TrueとFalseの値が反転するため、画像の白黒が逆転する。
大津の2値化手法については、以下で詳しく説明されています。

大津の二値化ってなんだ…ってなった. - Qiita
はじめに OpenCVを利用して二値化を行う際, 「とりあえずcv2.THRESH_OTSUやっとけばええやろ, ぽいー」って感じでテキトーに二値化してました. 「とりあえずいい感じに動く」って認識だったので, きちんと(?)理解自分なりに...
qiita.com
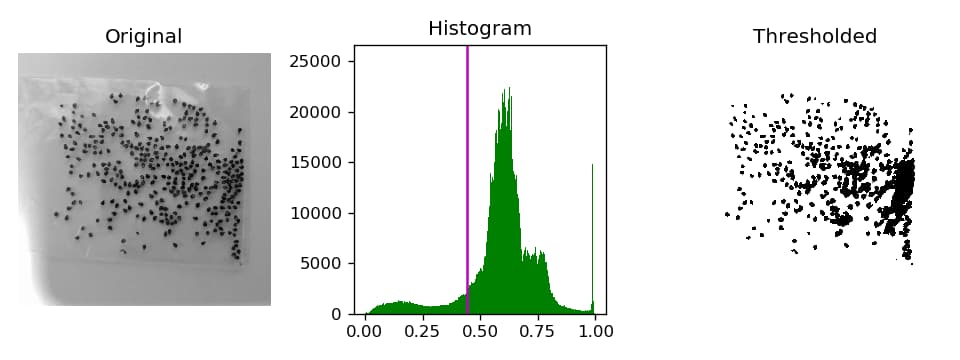
ヒストグラムと画像の表示
左側にオリジナル画像、中央にヒストグラム、右側にしきい値処理後の画像を表示しています。ヒストグラムの詳細については下記ページで解説しています。
[matplotlib] 6.ヒストグラムの作成方法と詳細なパラメータ調整
matplotlibライブラリを使用したヒストグラム作成方法を解説。基本的な作成手順からカスタマイズオプションまで網羅し、データ分布の視覚化に必要な技術を段階的に学べます。
sabopy.com
2019.02.14
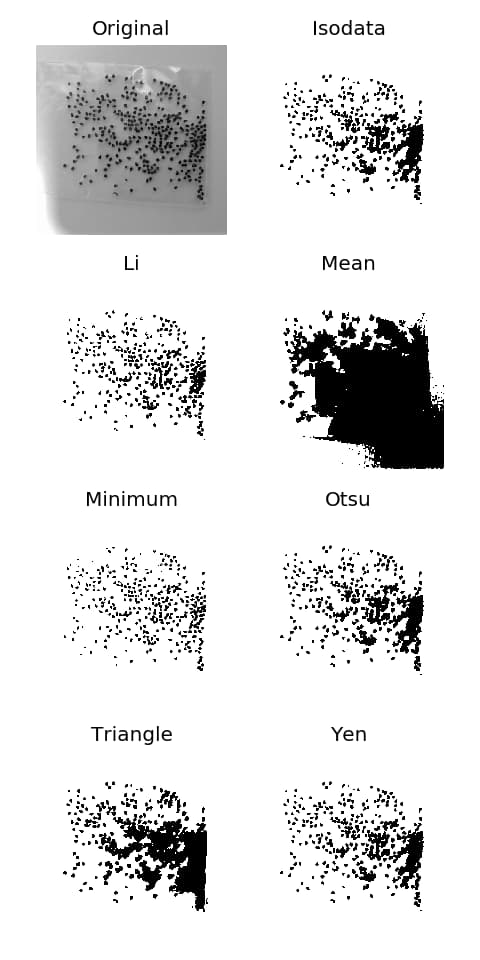
異なるしきい値処理を一度に試す
try_all_threshold関数を使用すると、様々な手法でしきい値処理した結果を比較表示することができます。
skimage.filters.thresholding.threshold_isodata
skimage.filters.thresholding.threshold_li
skimage.filters.thresholding.threshold_mean
skimage.filters.thresholding.threshold_minimum
skimage.filters.thresholding.threshold_otsu
skimage.filters.thresholding.threshold_triangle
skimage.filters.thresholding.threshold_yen
参考

Thresholding — skimage 0.26.0 documentation
scikit-image.org

skimage.filters — skimage 0.26.0 documentation
scikit-image.org

skimage.filters — skimage 0.26.0 documentation
scikit-image.org
コメント