はじめに
この記事では、seaborn-imageの機能の一つであるfftplotについて解説します。fftplotは画像にフーリエ変換を適用し、その結果を視覚的に表示する機能です。フーリエ変換は画像の周波数成分を分析する重要な手法であり、画像処理や信号解析において広く活用されています。

コード&解説
インストール
condaの方は
conda install -c conda-forge seaborn-imagepipの方は
pip install -U seaborn-imageでインストールできます。
モジュールのインポート
seaborn_image は isnsとして読み込みます。
バージョン
全体の設定
isns.set_image関数を使用して、デフォルトのカラーマップをcmap=”binary_r”に設定し、画像の原点をupper位置に指定します。
データの読み込み
サボテンのすみれ丸の画像を読み込みます。以下の画像を使用し、rgb2gray関数でグレースケール画像に変換しています。
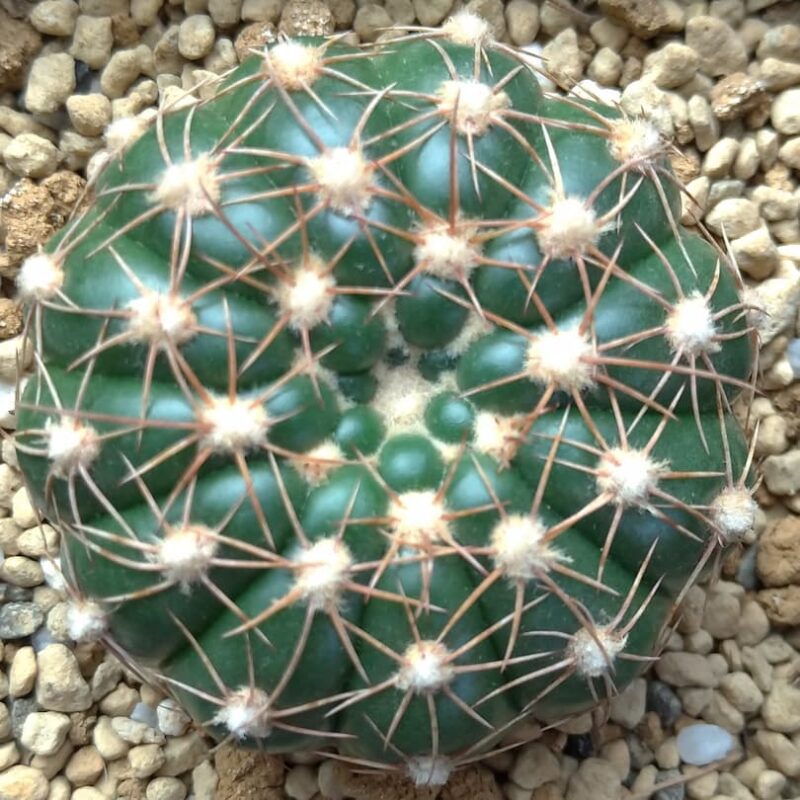
グレースケール画像をisnsのimgplotで表示すると次のようになります。

fftplot
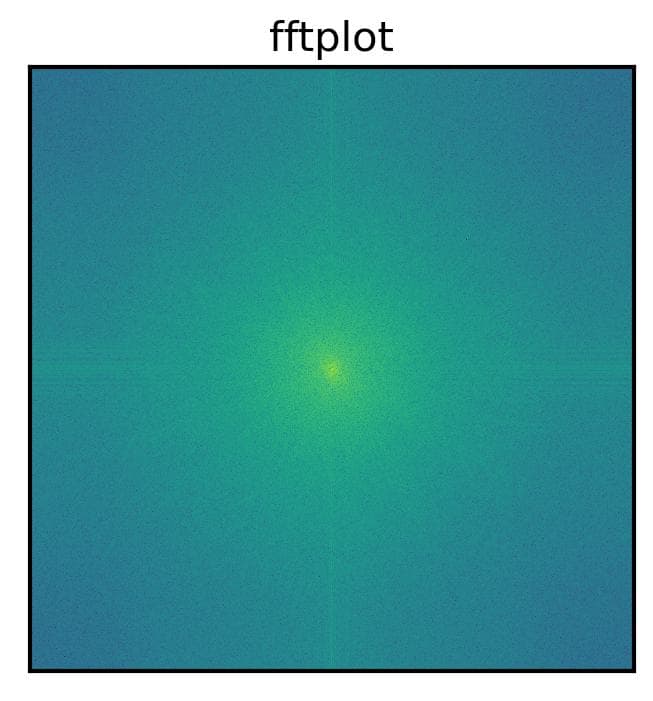
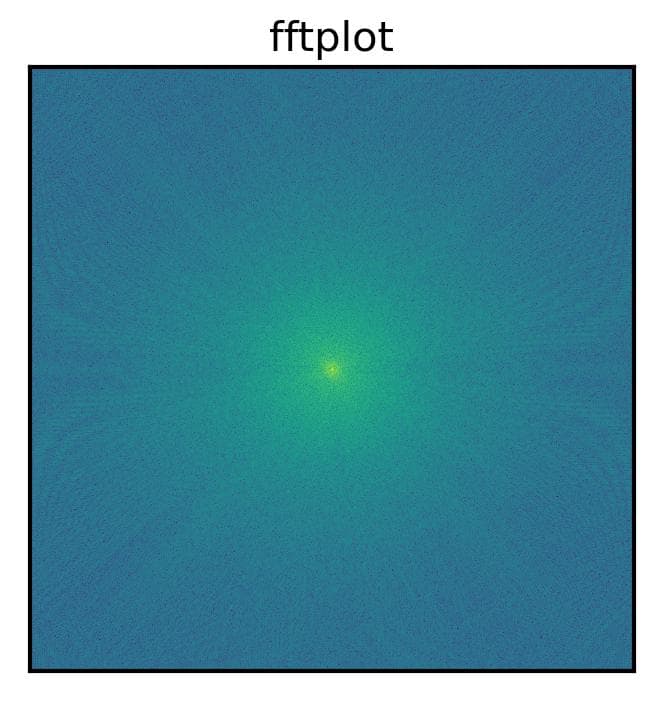
isns.fftplot(img_g, ax=ax)を実行するだけで、フーリエ変換した画像を簡単に表示できます。
窓関数の適用
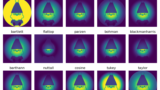
画像の端部分の影響を低減するための窓関数は、window_typeパラメータで適用できます。
使用可能な窓関数は、SciPyライブラリのsignal.windowsモジュールに含まれる関数です。

それぞれの窓関数の具体的な特性と効果については、下記ページで詳しく解説しています。
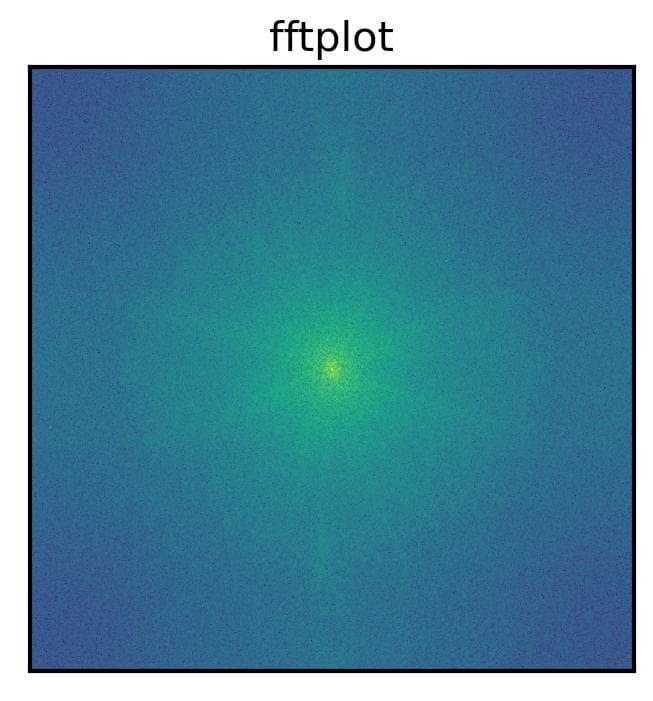
window_typeをhannとしたものは以下のようになります。
window_typeをboxcarとしたものは以下のようになります。
shift
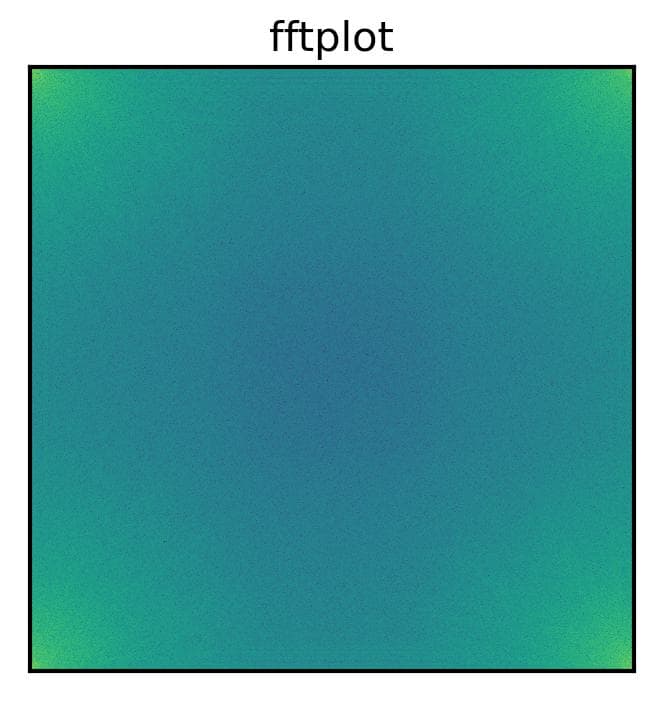
shift=Falseパラメータを設定すると、シフトしていないフーリエ変換像が表示されます。
cmap
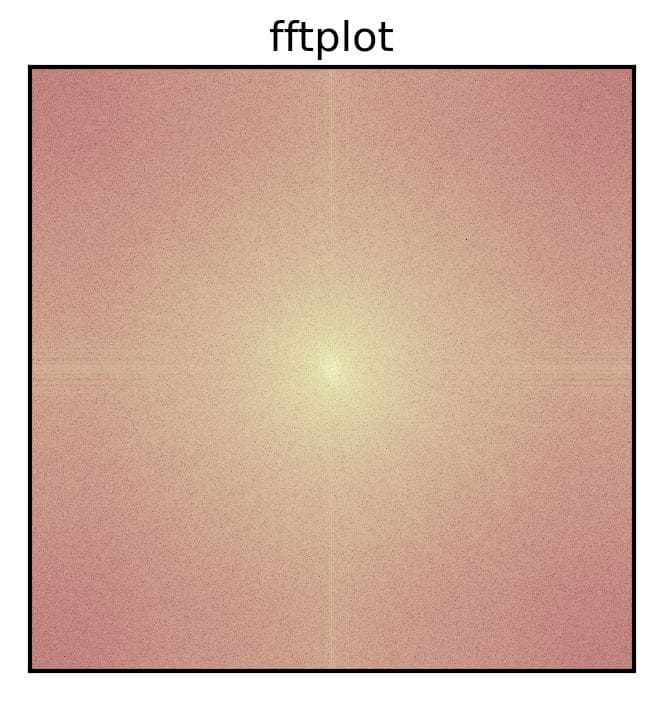
cmapでカラーマップを変更できます。
コードをダウンロード(.pyファイル) コードをダウンロード(.ipynbファイル)まとめ
seaborn-imageのfftplot機能を使うことで、画像のフーリエ変換結果を簡単に可視化できることを学びました。この機能は画像の周波数成分を理解するのに役立ち、ノイズ除去やパターン認識などの応用に有用です。シンプルなコードで高度な可視化が可能なseaborn-imageは、画像データを扱う際の強力なツールとなるでしょう。
参考


コメント