 matplotlib 3D
 [matplotlib animation] 48. 3Dグラフ上でのテキストのアニメーション
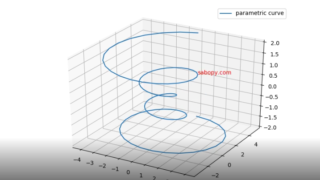
matplotlib のアニメーション機能を使用して、3D グラフ上でテキストを動的に表示・移動させる方法を解説します。mplot3d と animation モジュールを組み合わせ、3D 空間内でのテキストアニメーションの実装方法や応用例を紹介しています。
matplotlib 3D  matplotlib Animation
  matplotlib Animation
  matplotlib
  matplotlib
  matplotlib Animation
  matplotlib Animation
  matplotlib Animation