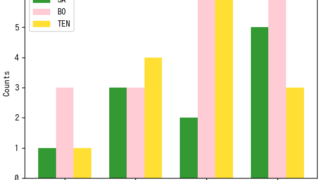
matplotlib

matplotlib Animation

[matplotlib animation] 27. スノーノイズ

matplotlib FuncAnimationでスノーノイズのアニメーションを作成する。
matplotlib

[matplotlib] 21. ヒストグラム付き散布図

axes_grid1を用いてヒストグラム付き散布図を表示する方法について解説します。
matplotlib

[matplotlib] 20. mpl_toolkits.axes_grid1 の使い方(ラベルとカラーバー)

axes_grid1を用いて複数の画像を表示する際のラベルとカラーバーの設定方法
matplotlib

[matplotlib] 18. カラーバーを図にあわせる

疑似カラーマップのカラーバーを図にあわせて表示
matplotlib

[matplotlib] 17. 疑似カラーマップを等高線風に表示

pcolormeshのカラーマップにレベルを設定して等高線風に表示
matplotlib

[matplotlib] 16. 疑似カラーマップ

pcolor, pcolormesh, pcolorfast, imshowなどを用いて疑似カラーマップを作成する方法について説明する。
matplotlib

[matplotlib] 15. 各軸の比率が等しい図

axis('equal')、axis('scaled')などを用いてx軸とy軸の比率が等しい図を作成する。
matplotlib

[matplotlib] 14. 図の中の一部を拡大して同じ図中に表示(zoomed_inset_axes)

mpl_toolkits.axes_grid1.inset_locator.zoomed_inset_axesを利用して、図の中の一部を拡大して同じ図中に表示