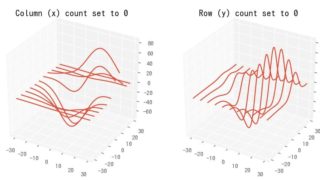
matplotlib 3D [matplotlib 3D] 27. 3D wireframeグラフでX軸またはY軸方向 のみのデータを表示する方法 matplotlib の3D wireframeグラフでX軸またはY軸方向のみのデータを表示する方法を解説。特定方向のグリッドだけを表示して視覚的に強調するテクニックを紹介します。 2018.10.26 matplotlib 3Dpython
matplotlib 3D [matplotlib 3D] 14. 3Dグラフの回転アニメーション matplotlib mplot3d のグラフの回転アニメーション 2018.10.25 matplotlib 3Dmatplotlib Animationpython
matplotlib 3D [matplotlib 3D] 26. ArtistAnimationで3D wireframe plotをアニメーションで表示 Matplotlibを使用した3Dワイヤーフレームプロットのアニメーション表示方法について解説します。ArtistAnimationを活用して動的な3Dグラフィックスを作成する手順とコード例を紹介。 2018.10.24 matplotlib 3Dmatplotlib Animationpython
matplotlib 3D [matplotlib 3D] 16. 複数の3Dグラフを横並びで表示する方法 matplotlibを使って複数の3Dグラフを横並びに表示する方法を解説しています。subplotsを活用して異なる視点や種類の3Dグラフを効率的に比較できる技術を紹介。データ可視化の幅を広げる実践的なテクニックです。 2018.10.16 matplotlib 3Dpython