sabopy

matplotlib

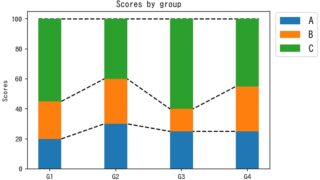
[matplotlib] 22. 区分線が表示された積み上げ棒グラフ

matplotlibで棒グラフに区分線を表示する方法について説明する。
その他

[matplotlibで錯視] 6. エーレンシュタイン錯視2

matplotlibでエーレンシュタイン錯視2を作成する
その他

[matplotlibで錯視] 5. エーレンシュタイン錯視1

matplotlibでエーレンシュタイン錯視1を作成する
matplotlib Animation

[matplotlib animation] 27. スノーノイズ

matplotlib FuncAnimationでスノーノイズのアニメーションを作成する。
matplotlib

[matplotlib] 21. ヒストグラム付き散布図

axes_grid1を用いてヒストグラム付き散布図を表示する方法について解説します。
matplotlib

[matplotlib] 20. mpl_toolkits.axes_grid1 の使い方(ラベルとカラーバー)

axes_grid1を用いて複数の画像を表示する際のラベルとカラーバーの設定方法
matplotlib

[matplotlib] 19. mpl_toolkits.axes_grid1 の使い方(画像の表示)

axes_grid1のImageGridを用いて複数の画像を表示する方法
matplotlib

[matplotlib] 18. カラーバーを図にあわせる

疑似カラーマップのカラーバーを図にあわせて表示