 matplotlib
 [matplotlib] 19. mpl_toolkits.axes_grid1 の使い方(画像の表示)
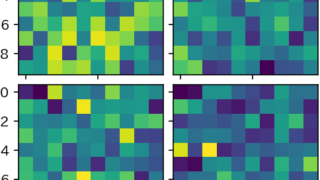
axes_grid1のImageGridを用いて複数の画像を表示する方法
matplotlib 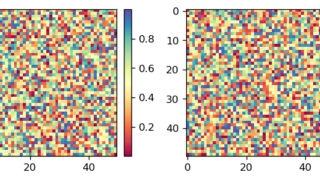 matplotlib
 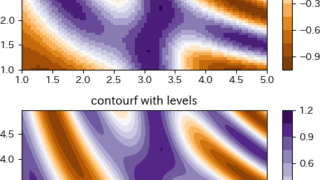 matplotlib
 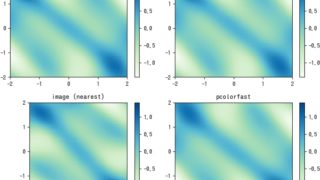 matplotlib