はじめに
複数のヒストグラムを比較する際、それらを重ねて表示することが一般的です。しかし、ヒストグラムが重なり合うと、各分布の広がりを正確に把握することが困難になります。本稿では、棒グラフのalpha値(透明度)を調整して、ヒストグラムの視認性を向上させる方法を説明します。
コード
解説
モジュールのインポートなど
バージョン
データの生成
np.random.randn()を使用して標準正規分布(平均0、標準偏差1)の乱数を生成します。その後、np.histogramを使用してこのデータをヒストグラム形式に変換します。
全て不透明なヒストグラムの場合
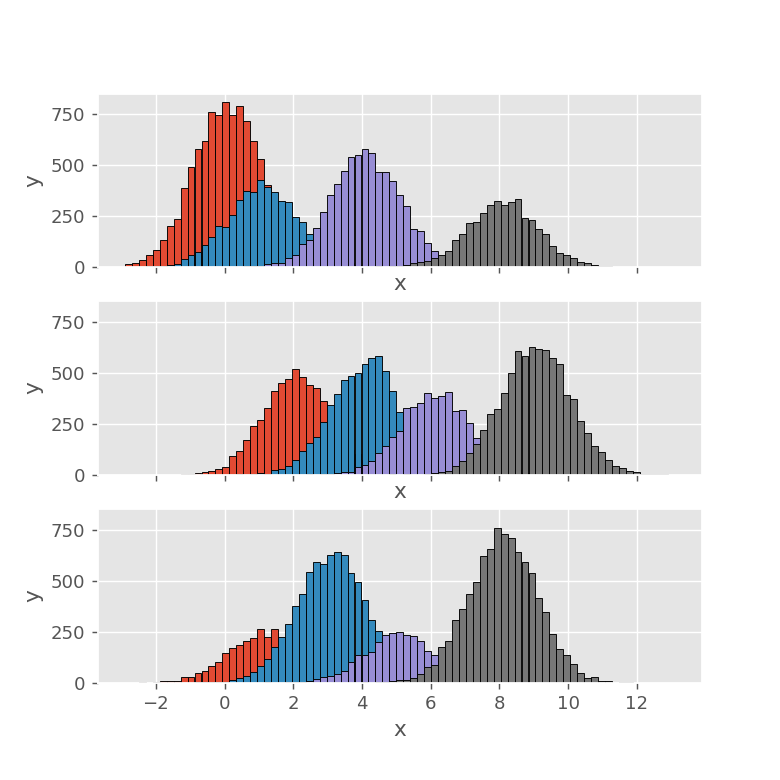
全てのヒストグラムのalphaを1(完全不透明)に設定した場合、下図のようになります。ヒストグラムが互いに重なり合うため、後ろにある分布の一部が見えなくなってしまいます。
ヒストグラムのalphaを調整した場合
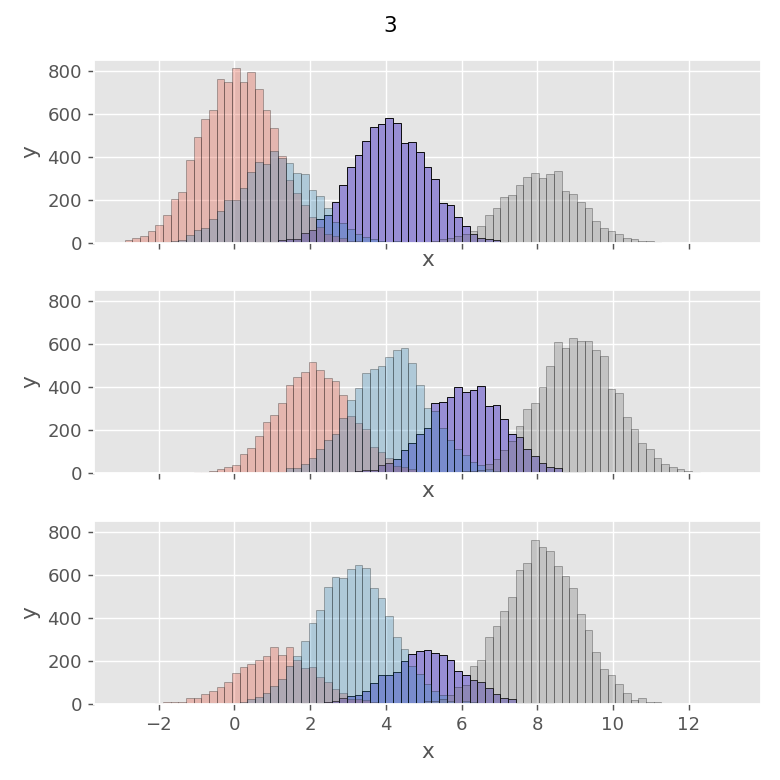
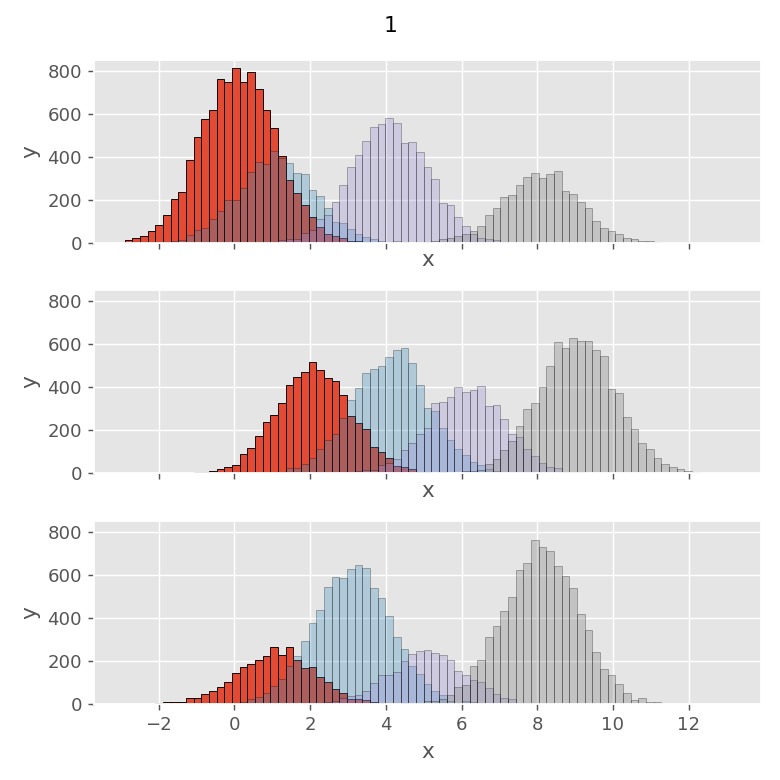
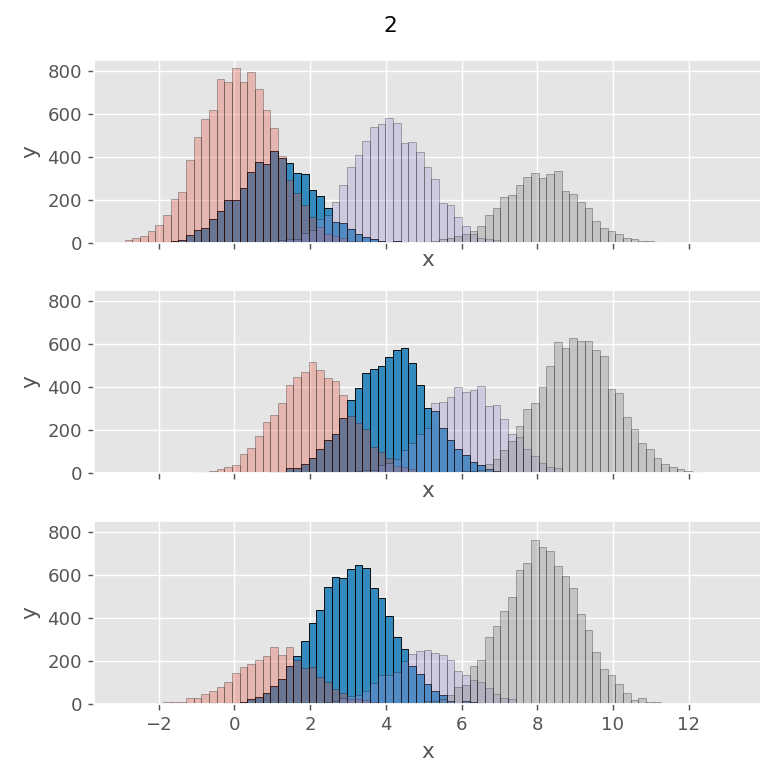
1つのヒストグラムを不透明にし、その他を透明にした場合、以下のような表示になります。これにより、重なり合っている部分が明確に表示され、各分布の関係性がより把握しやすくなります。
不透明なヒストグラムが前面に表示されてしまう場合は、zorderパラメータを設定することで、不透明なヒストグラムを背面に配置できます。
参考


numpy.histogram — NumPy v2.4 Manual
numpy.org

matplotlib.pyplot.bar — Matplotlib 3.10.9 documentation
matplotlib.org
コメント