 matplotlib
 [scikit-learn] 7. make_swiss_rollによるロールケーキ状データの生成
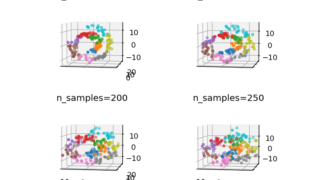
scikit-learnのdatasets.make_swiss_roll関数を使用してロールケーキ状の3次元データを生成する方法と、各種パラメータがデータ分布に与える影響について解説します。機械学習のデータ可視化や次元削減の実験に最適です。
matplotlib 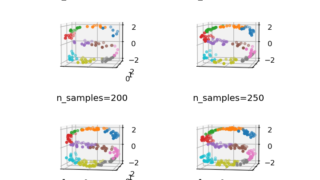 matplotlib
  matplotlib
  matplotlib
  matplotlib
  matplotlib
  matplotlib
 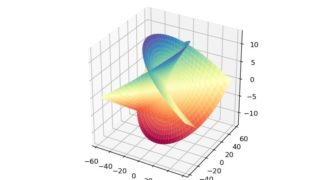 matplotlib