 ipywidgets
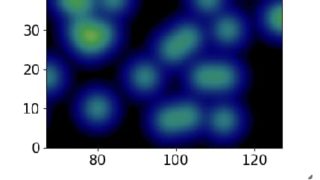
 [ipywidgets] 11. IntRangeSliderで画像の表示範囲を調整する – Jupyter Notebook / labでの対話的パラメータ調整
Jupyter Notebookの対話的ウィジェットであるIntRangeSliderを使って画像表示範囲を調整する方法を解説します。実装例とともに、データ可視化の効率化と画像処理の直感的な操作方法を紹介し、科学計算やデータ分析のワークフローを向上させる技術について説明します。
ipywidgets  ipywidgets
  ipywidgets
  Pandas
  matplotlib Animation
  matplotlib
 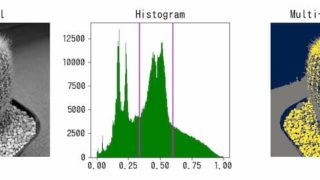 python
  matplotlib Animation