 python
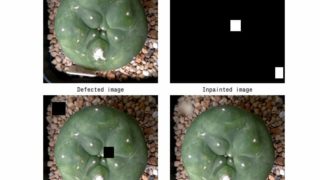
 [scikit-image] 37. 画像の欠損部分を修復(skimage.restoration inpaint)
scikit-imageライブラリのrestoration.inpaint関数を使って画像の欠損部分を修復する方法を解説します。マスク画像の作成方法、修復アルゴリズムの選択、実践的な例を通じて画像修復の基本を学びましょう。
python  python
  matplotlib Animation
  ipywidgets
 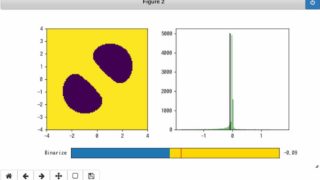 matplotlib
  matplotlib
  matplotlib