 python
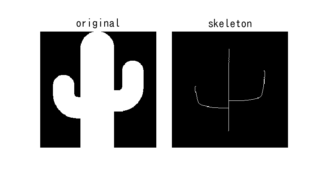
 [scikit-image] 23. 画像の細線化処理(morphology.skeletonize)
scikit-imageのmorphology.skeletonize関数を使った画像の細線化処理について解説。物体の骨格抽出の基本から応用例まで、画像処理技術の効率化に役立つ情報を提供します。
python  matplotlib
  matplotlib
  python
  python
  matplotlib Animation
  matplotlib Animation