 matplotlib
 [matplotlib] 19. mpl_toolkits.axes_grid1 の使い方(画像の表示)
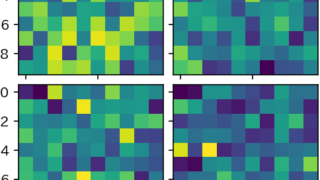
Matplotlib の拡張モジュール mpl_toolkits.axes_grid1 を使って複数画像を効率的に表示する方法を解説。ImageGrid による整然としたレイアウト、スケールバー・カラーバーの追加など、科学計算や画像処理に役立つ可視化テクニックを紹介しています。
matplotlib 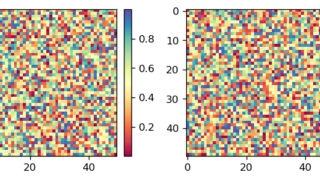 matplotlib
 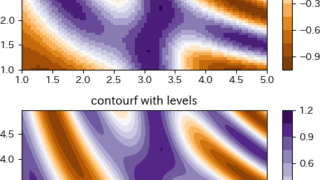 matplotlib
 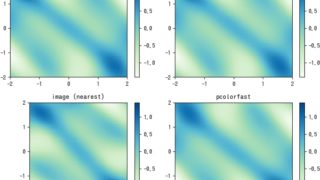 matplotlib
 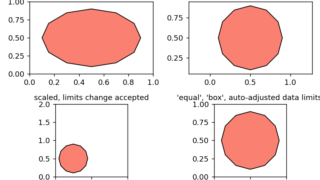 matplotlib
  matplotlib
  matplotlib
  matplotlib