Introduction
python matplotlib animation of sphere rotating about the z axis.
Code
Explanation
In ↓, I created an animation that changes the viewpoint. For this time, rotate the plotted ball with the z axis as the rotation axis.
Setting to make it 3D graph
Generate data to plot
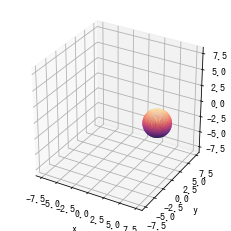
u and v are angles in polar coordinates. In polar coordinates the balls are as follows.
$$x=rcos\theta sin\phi, y=rsin\theta sin\phi, z=rcos\phi$$In order to be able to plot, create meshgrid data.
np.outer () is the cross product, multiplying all of the elements of two data.
For np.ones (np.size (u)), np.size () returns the number of elements, so np.size (u) is 100. As a result, it becomes np.ones (100), and array data whose elements are all 1’s and whose size is 100 is generated.
Since it is +6 with x, a sphere of radius 2 is formed at (6, 0, 0).
Axis range, label setting
ax.set_aspect (‘equal’) makes the aspect ratios of x, y, and z axes uniform.
Create a 3D surface graph
For animation to display, plot must be enclosed in [] to make it a list.
Setting graphs to be displayed in animation
This animation is animated by updating plot [0] from time to time. So first remove the previous graph with remove ().
Then, it rotates. Assuming that the rotation angle is γ, the equation when it rotates by an angle γ about the Z axis is
Display animation
Create animation with FuncAnimation.
Draw animaton of update in fig, frame number is 100, interval is 100 ms so 10 s movies. Since fargs is an argument to be passed to update, put x, y, z, u and plot
You can display animation on jupyter notebook with to_html5_video ().
コメント