
はじめに
この記事では、Jupyter Notebookにおけるipywidgetsのinteract機能を活用して、画像の二値化処理を対話的に行う方法について説明します。しきい値をヒストグラム上でリアルタイムに調整しながら、画像の二値化結果を確認できる手法を解説します。
コード
解説
モジュールのインポート
データの生成
2値化に用いる画像
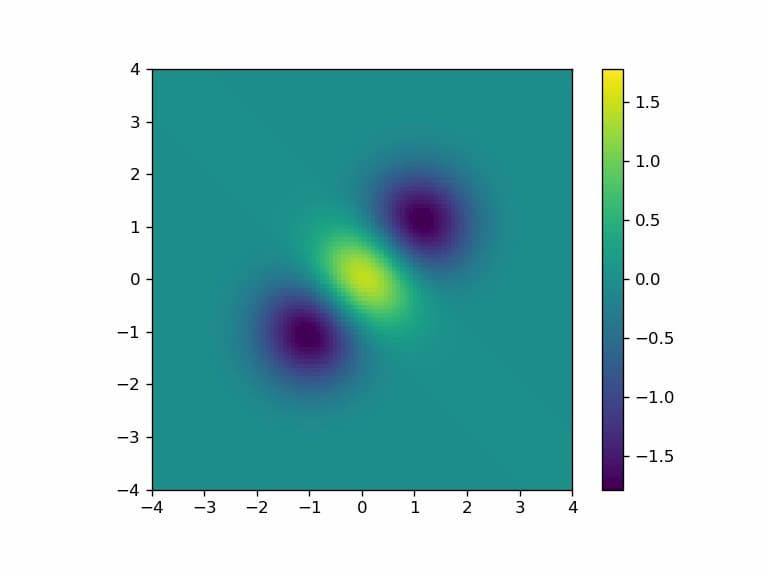
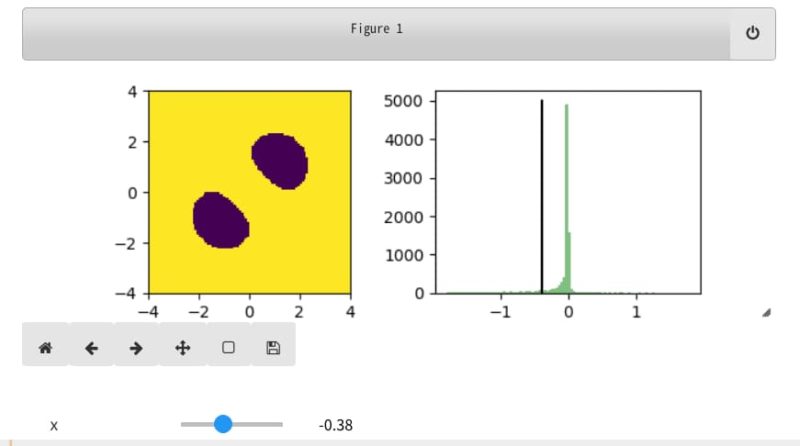
この画像を2値化処理します。なお、この画像はmatplotlibのSliderで使用したものと同一です。
ヒストグラムの設定
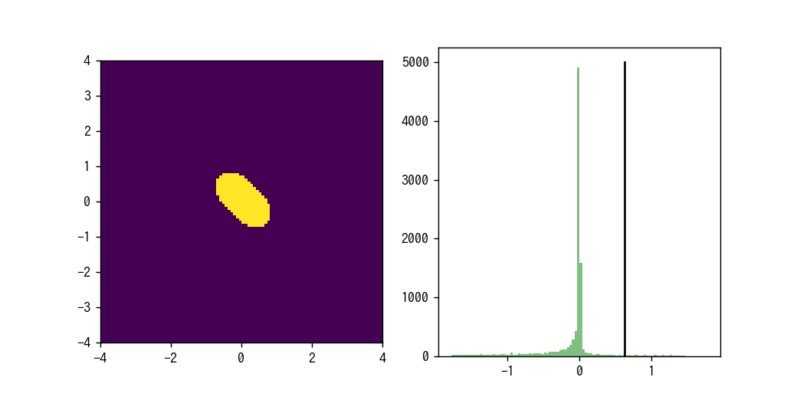
plt.subplots(1, 2)を使って横に並んだ2つの図を作成します。左側の図(ax1)には2値化像を、右側の図(ax2)にはヒストグラムを表示します。ヒストグラムはax.hist()関数で生成しています。
ヒストグラム上にしきい値を示す垂線を表示するために、l, = ax2.plot((ini,ini),(0,5000),’k-‘)というコードを使用しています。
interactの設定
2値化は binarized = Z>x で行います。これによって x より大きい要素が True となり、それ以外の要素は False となります。
ax1.imshow(binarized, interpolation='None', origin='lower', extent=[-4, 4, -4, 4]) を使用して2値化像を表示します。
l.set_xdata((x,x)) によって、しきい値を示す垂線の位置を更新します。
interactの適用
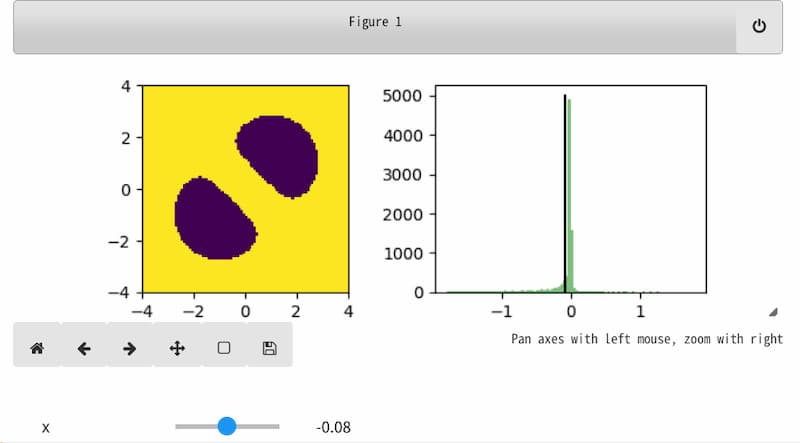
interact(f, x=(vmin,vmax))を使用すると、vminからvmaxの範囲で値を調整できるスライダーが表示されます。スライダーの値を変更するたびに関数f(x)が自動的に実行され、結果がリアルタイムで更新されます。
スライダーを動かしたときの変化
まとめ
本記事では、Jupyter Notebookのipywidgetsモジュールにあるinteract機能を活用して、画像の二値化処理を対話的に行う方法を解説しました。ヒストグラム上でしきい値を調整しながらリアルタイムで二値化結果を確認できるため、最適な処理パラメータを効率的に見つけることができます。この手法は画像処理だけでなく、様々なパラメータ調整が必要な場面で応用可能です。
参考


コメント